Jun (Chün) glaze tests: grid test 3
In this grid test, I honed in on the most successful zone from my previous tests. Here are the corner recipes:
Corner A = DP 1249 : High Silica Corner
50% DP granite
25% Silica
15% Wollastonite
10% Mahavir (potash feldspar)
+ 1.5% Dolomite
+2% Bentonite
+2% Bone Ash
+1.5% RIO
Corner B = DP 1218 : High Silica and Wollastonite (calcia) Corner
45% DP granite
25% Silica
25% Wollastonite
5% Mahavir (potash feldspar)
+ 1.5% Dolomite
+2% Bentonite
+2% Bone Ash
+1.5% RIO
Corner C = DP 1244 : High Wollastonite (calcia) Corner
50% DP granite
25% Wollastonite
15% Silica
10% Mahavir (potash feldspar)
+ 1.5% Dolomite
+2% Bentonite
+2% Bone Ash
+1.5% RIO
Corner D = DP 1248 : High Devil’s Playground Granite Corner
65% DP granite
20% Silica
15% Wollastonite
+ 1.5% Dolomite
+2% Bentonite
+2% Bone Ash
+1.5% RIO
And the results…
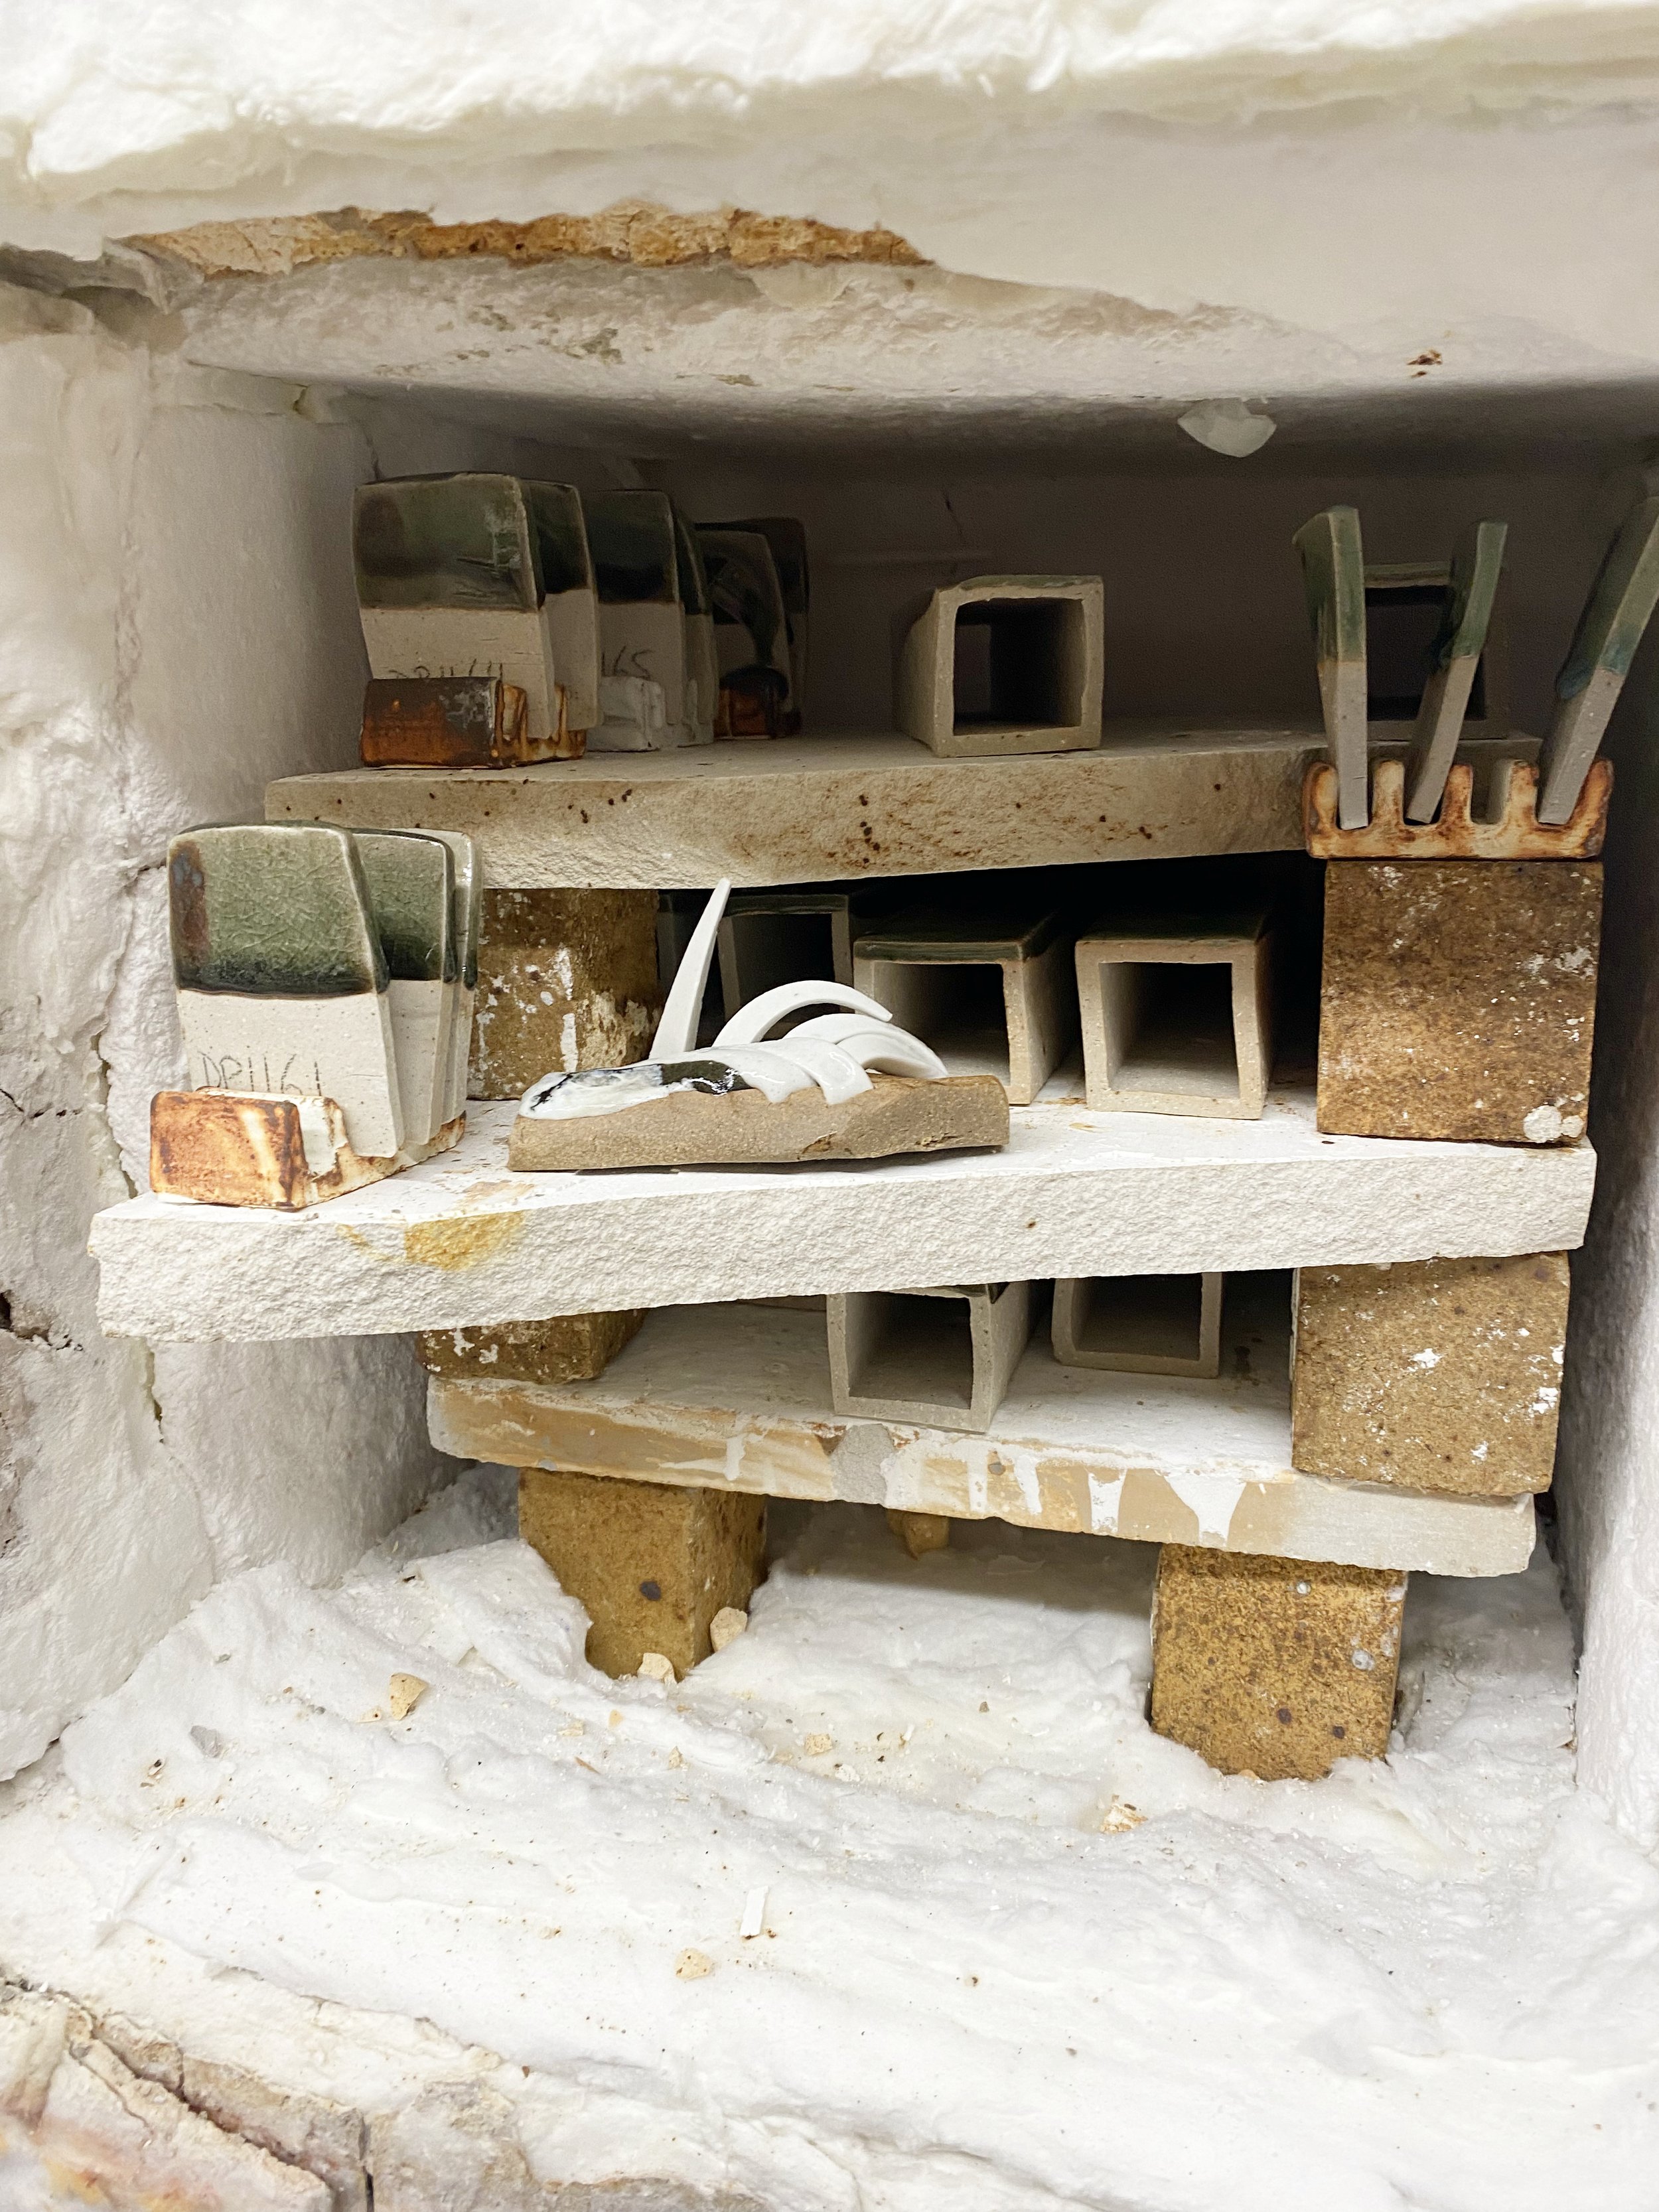
Here are the vertically fired tiles which show us more information…
These tests show us how important the atmosphere in the kiln is. Aside from the glazes in the top row (and one below it, really), which seem a bit dry, every test in this grid has the potential to be a Jun glaze. The changes in composition are fairly minimal. The inconsistencies in the results were a little frustrating to me at first, but now I see they provide a solid lesson: Reduction is really important for the phase separation and color of these glazes.
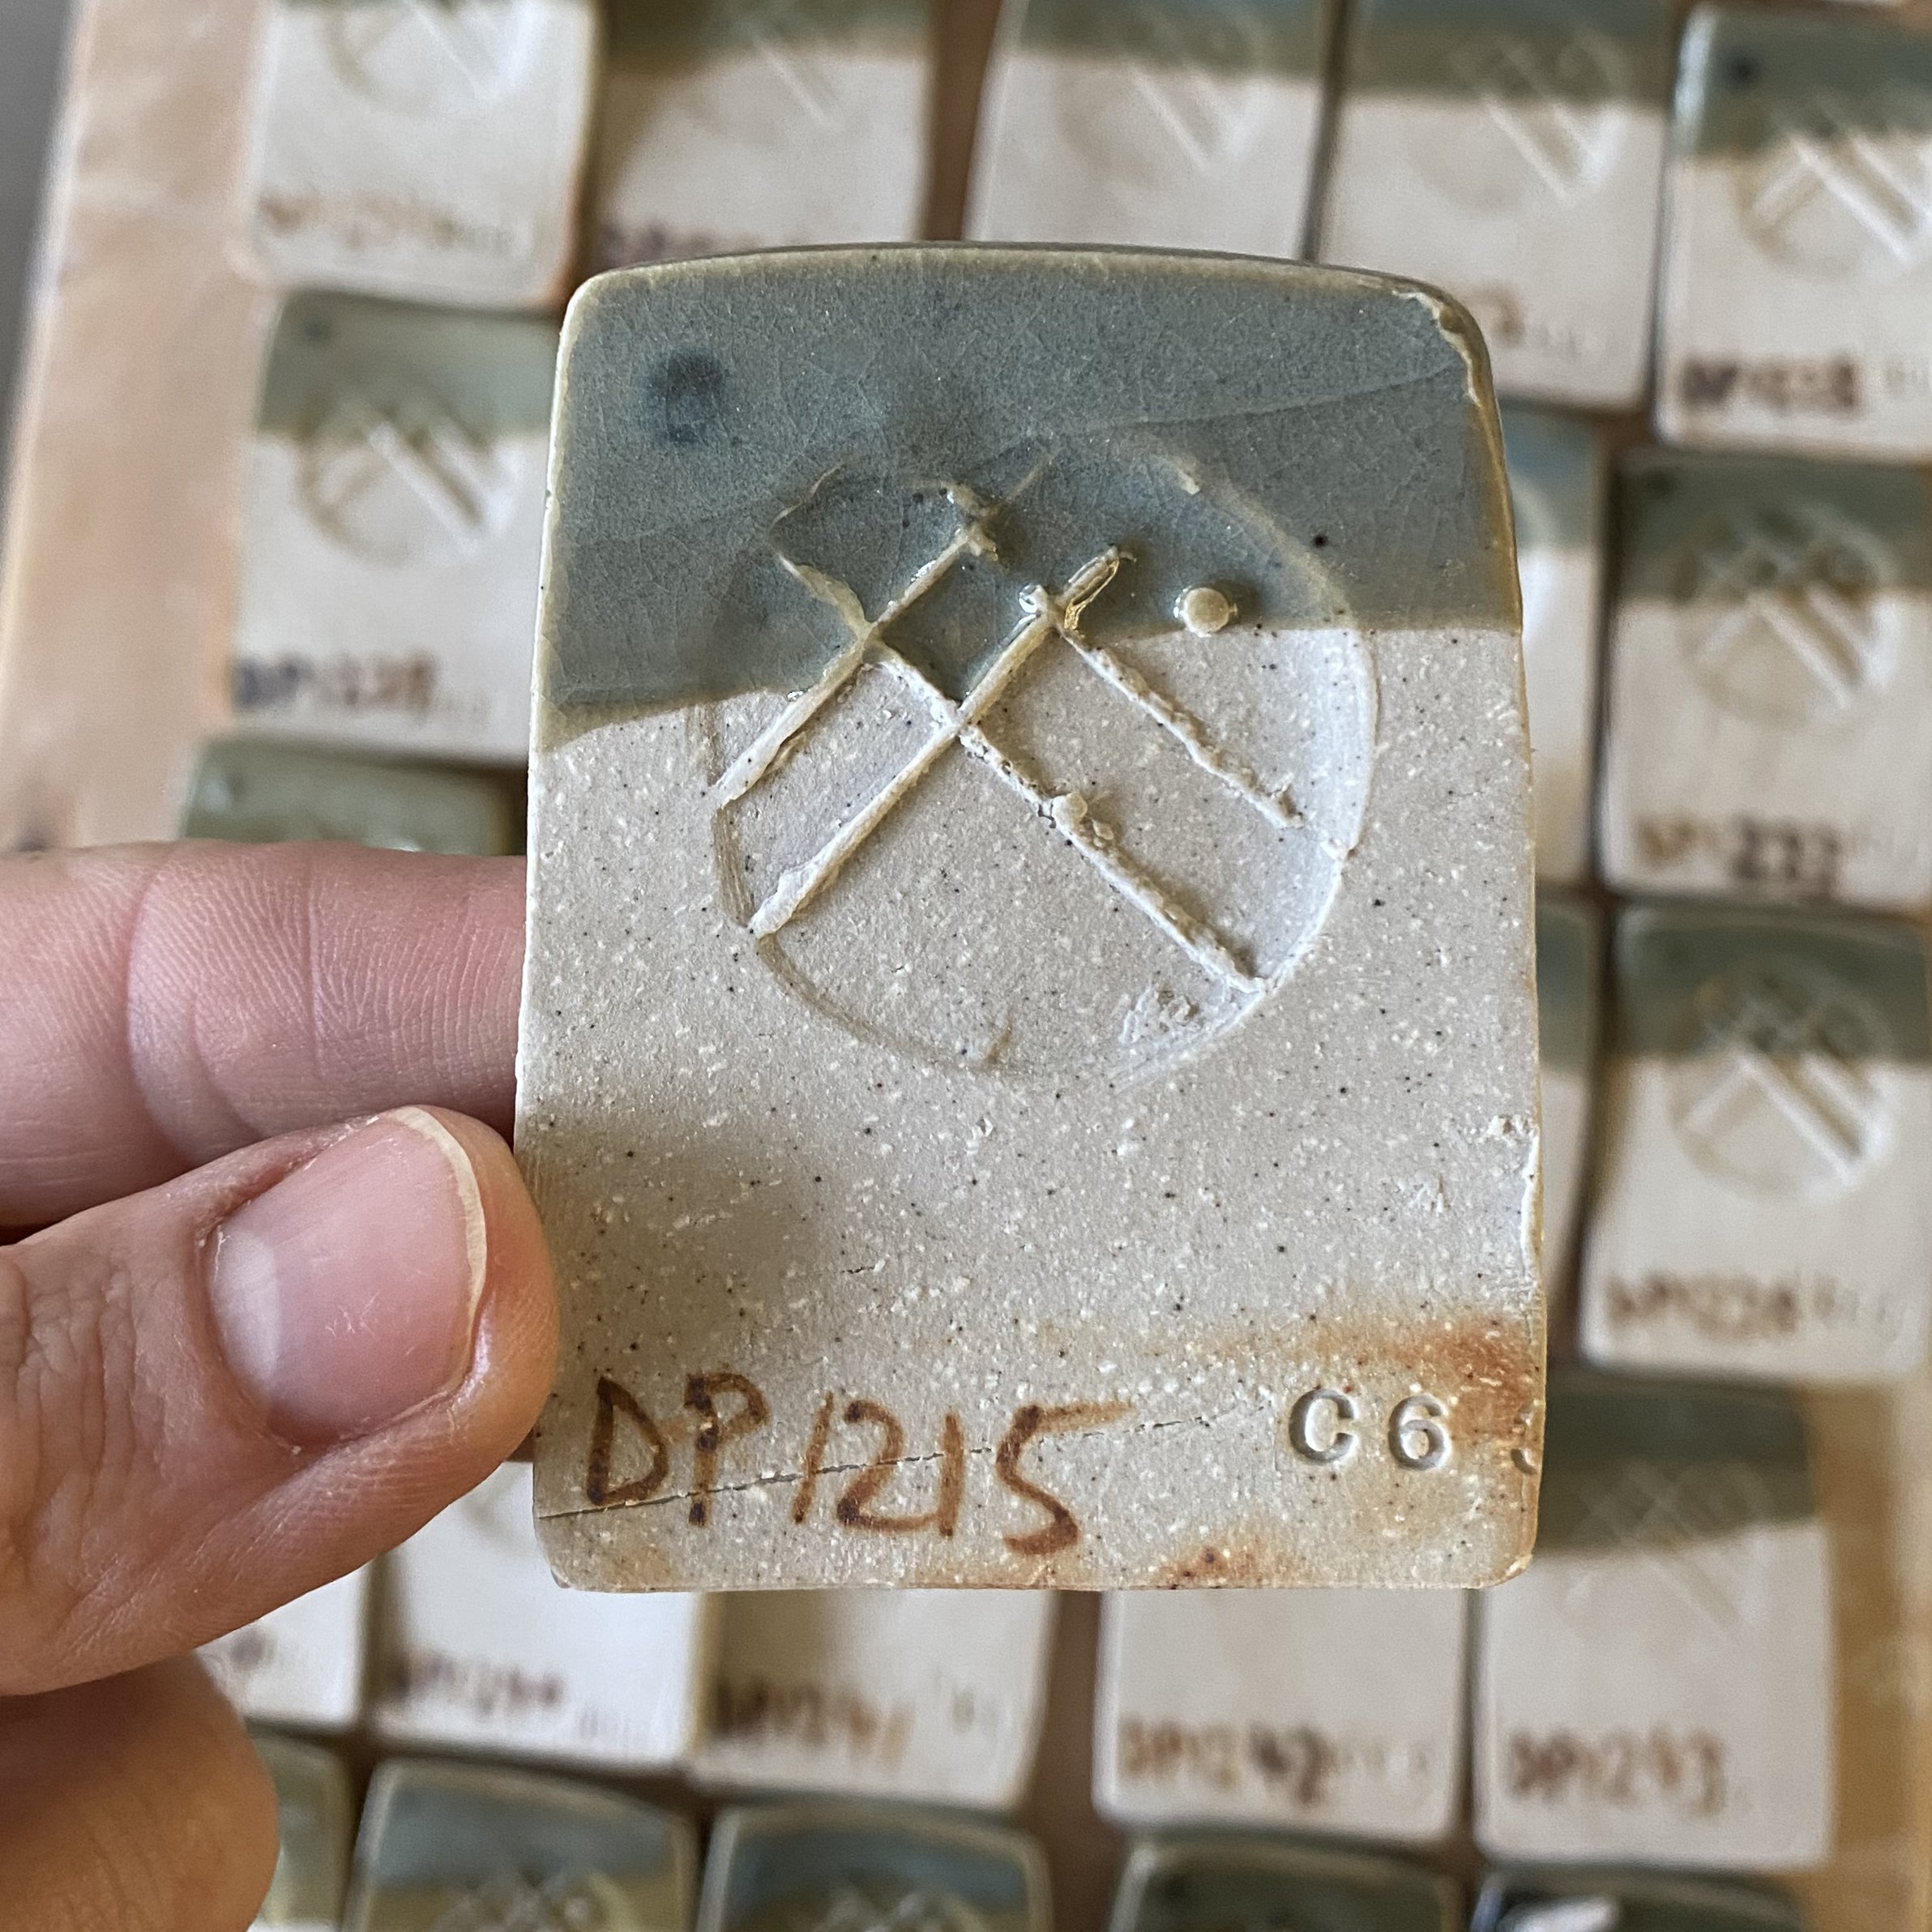
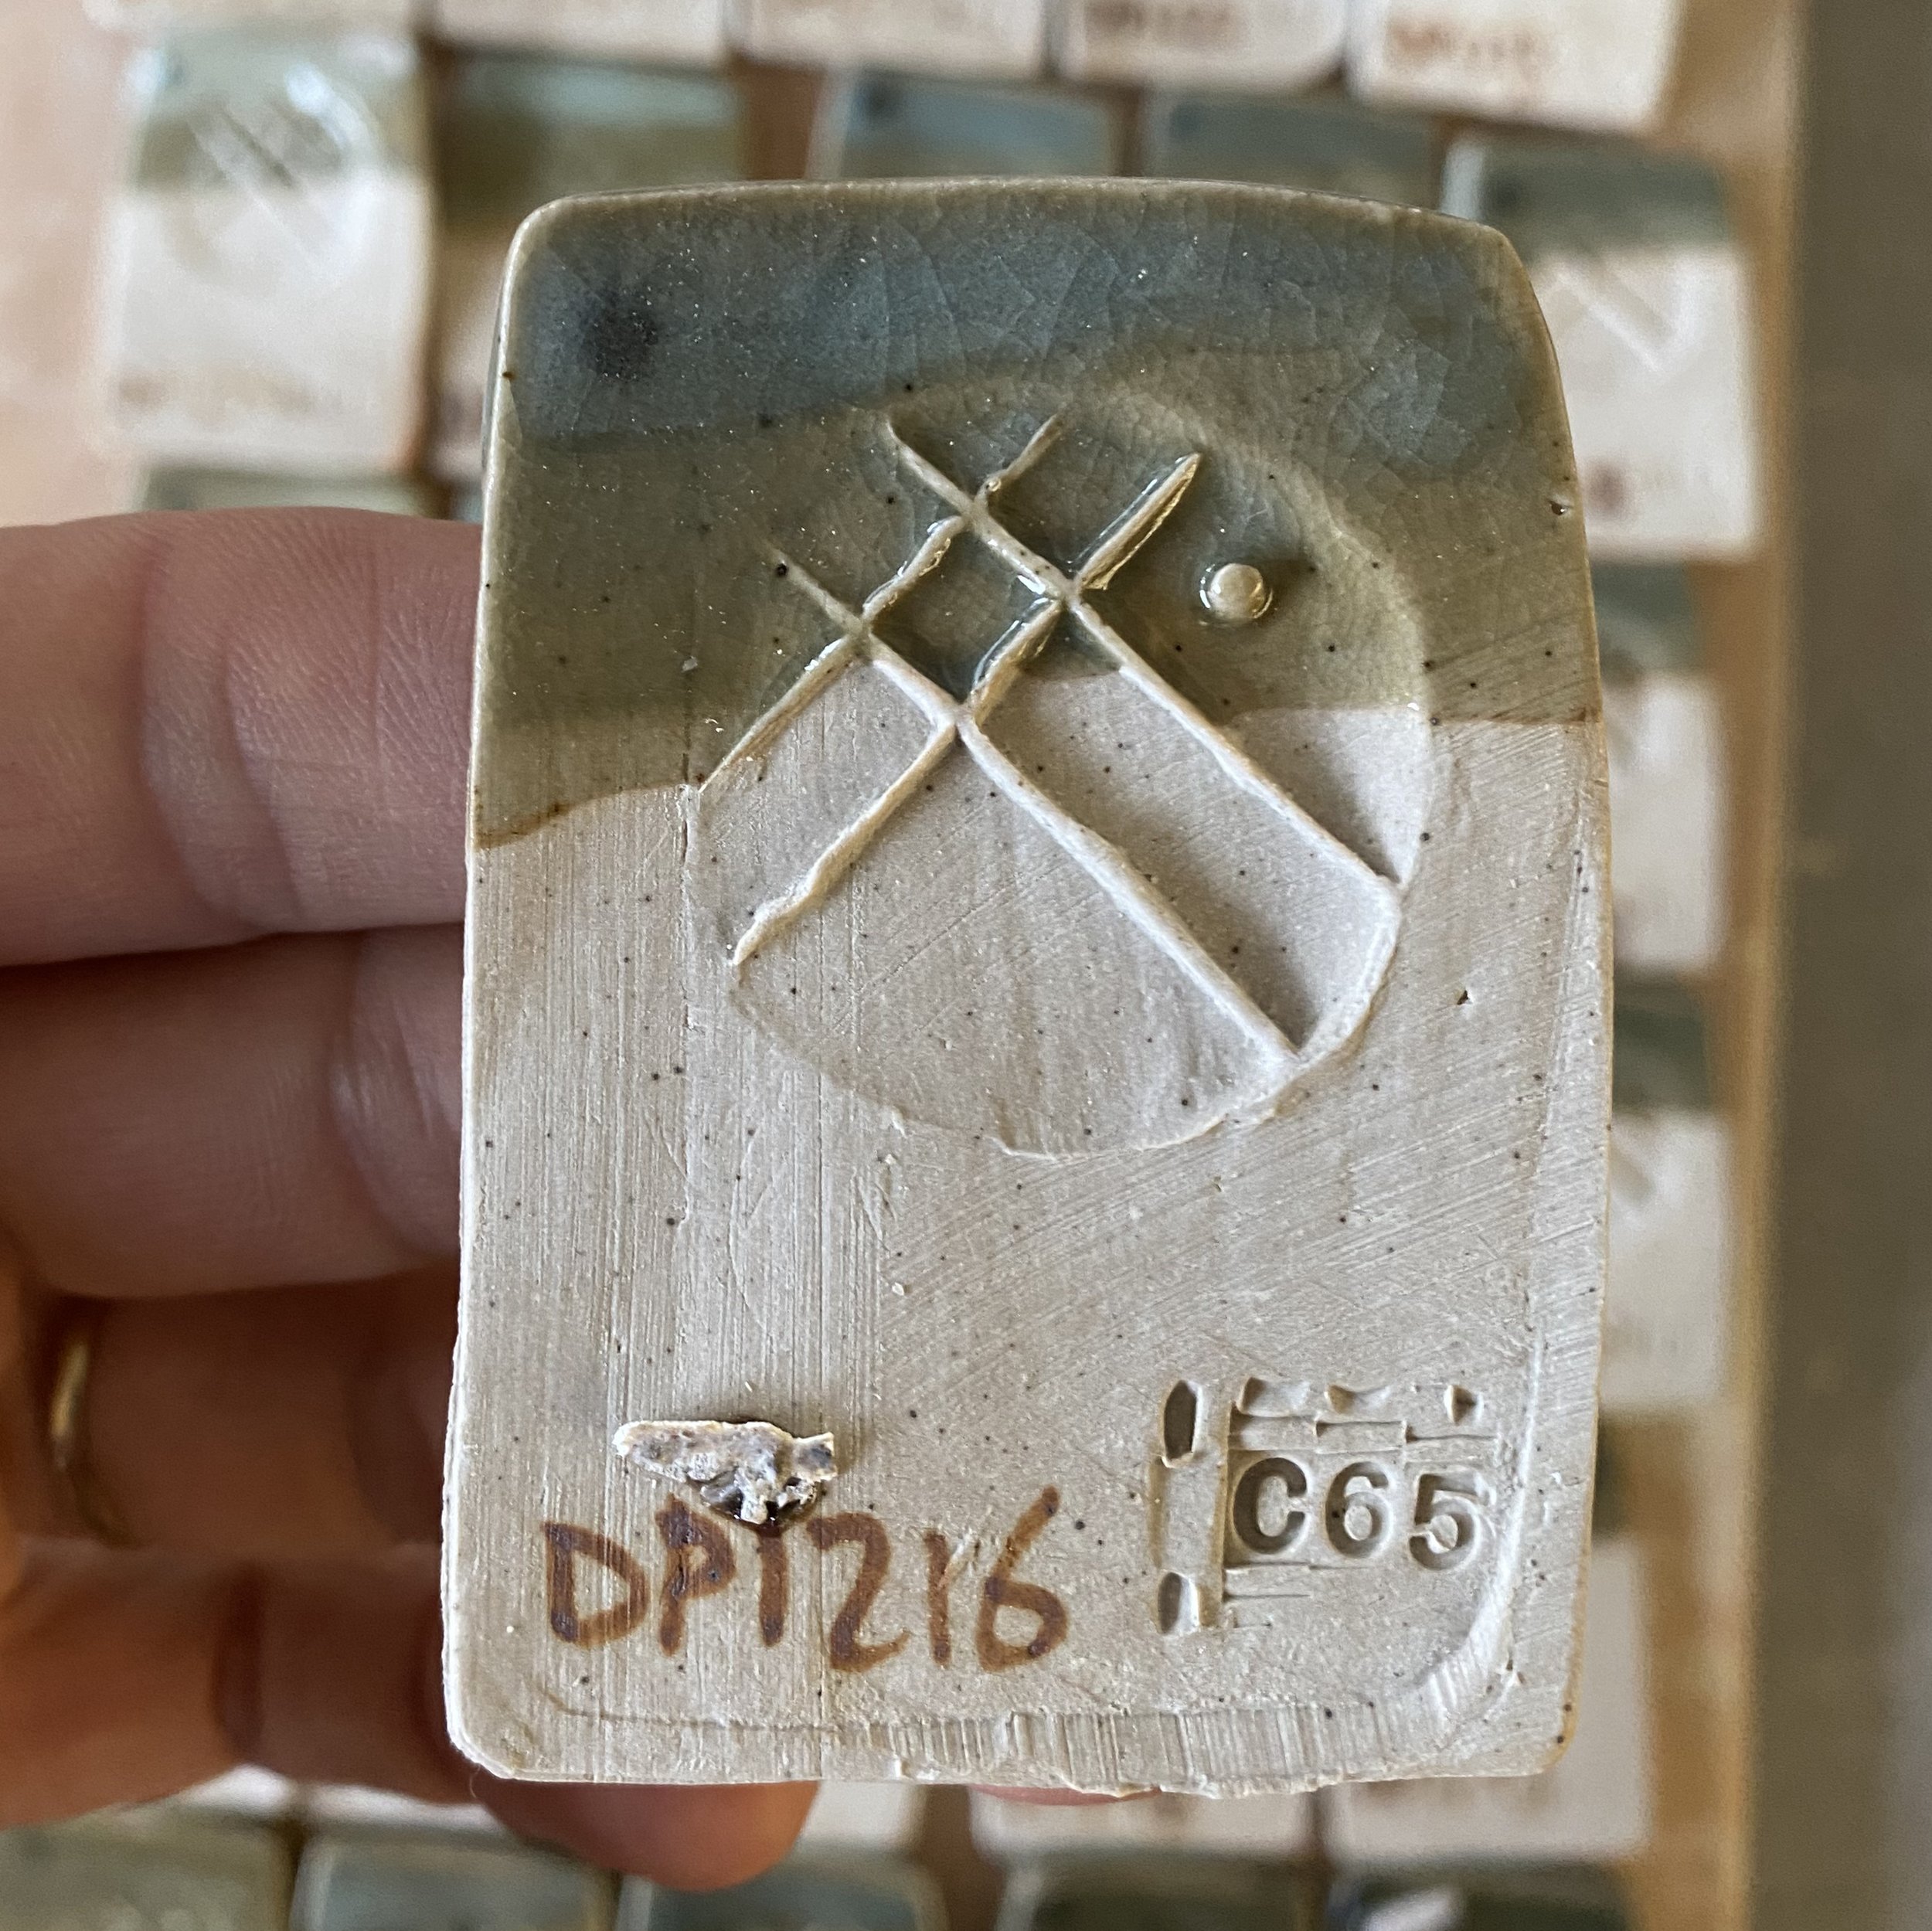
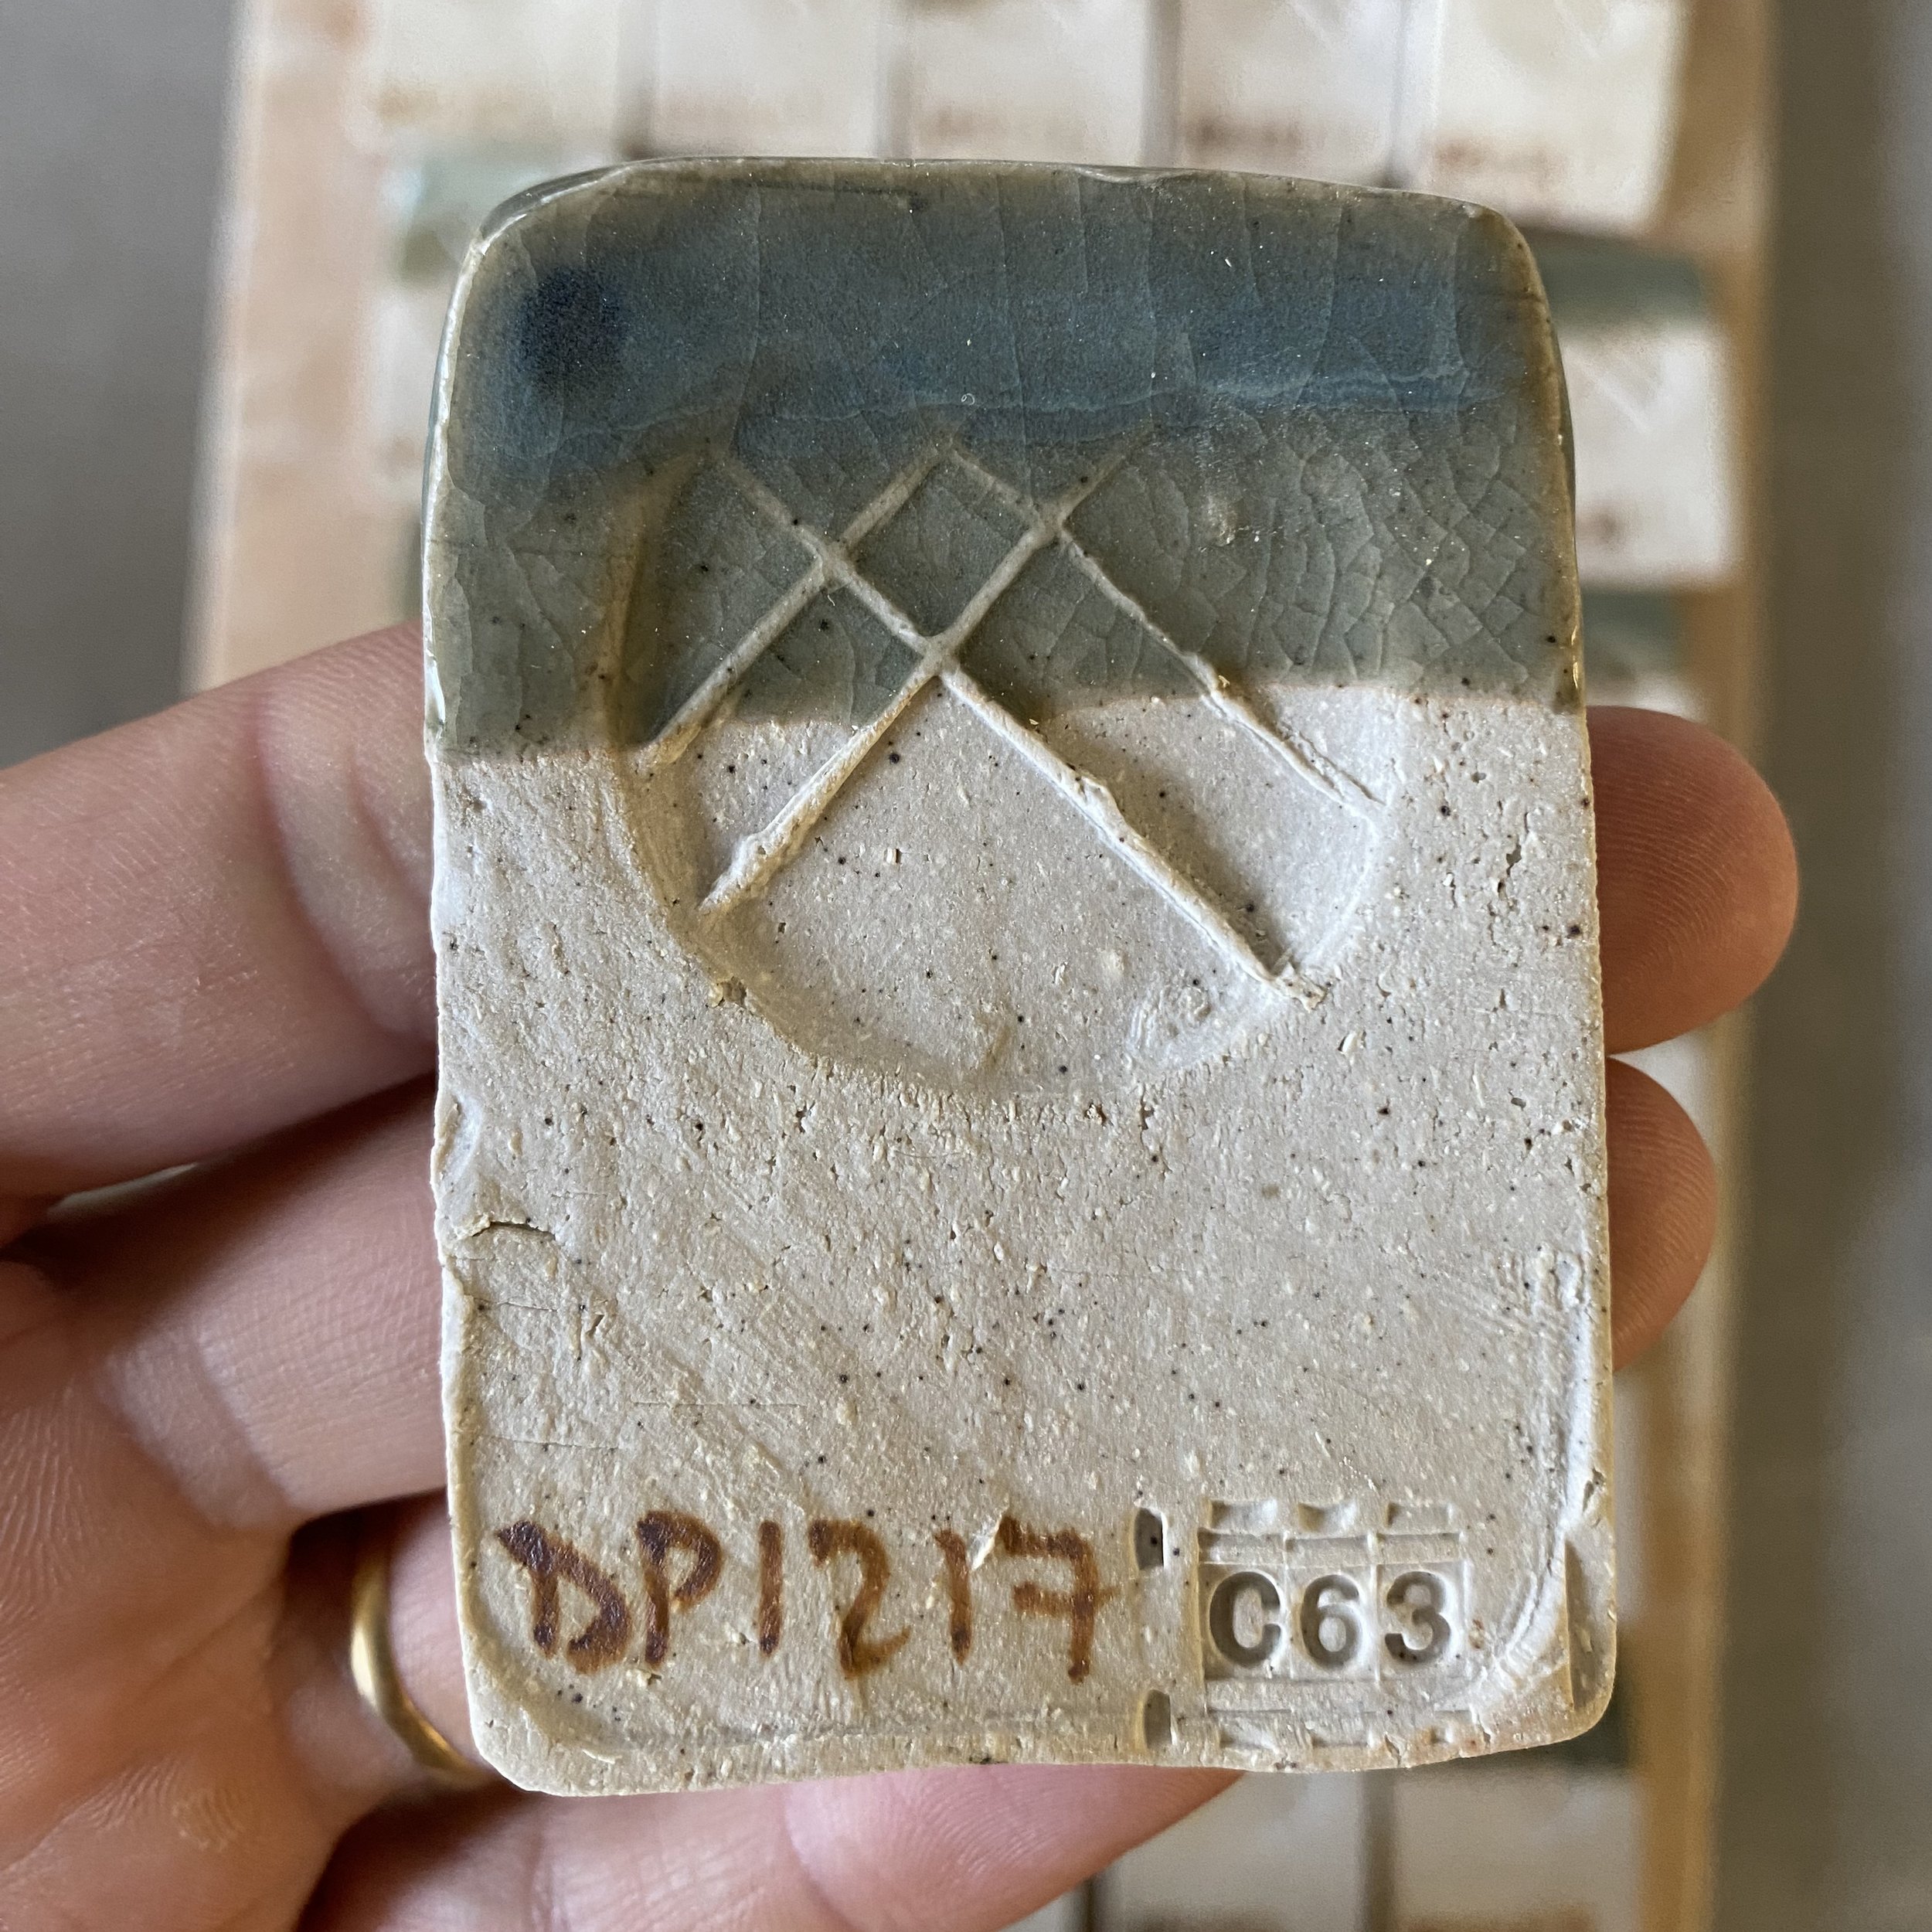
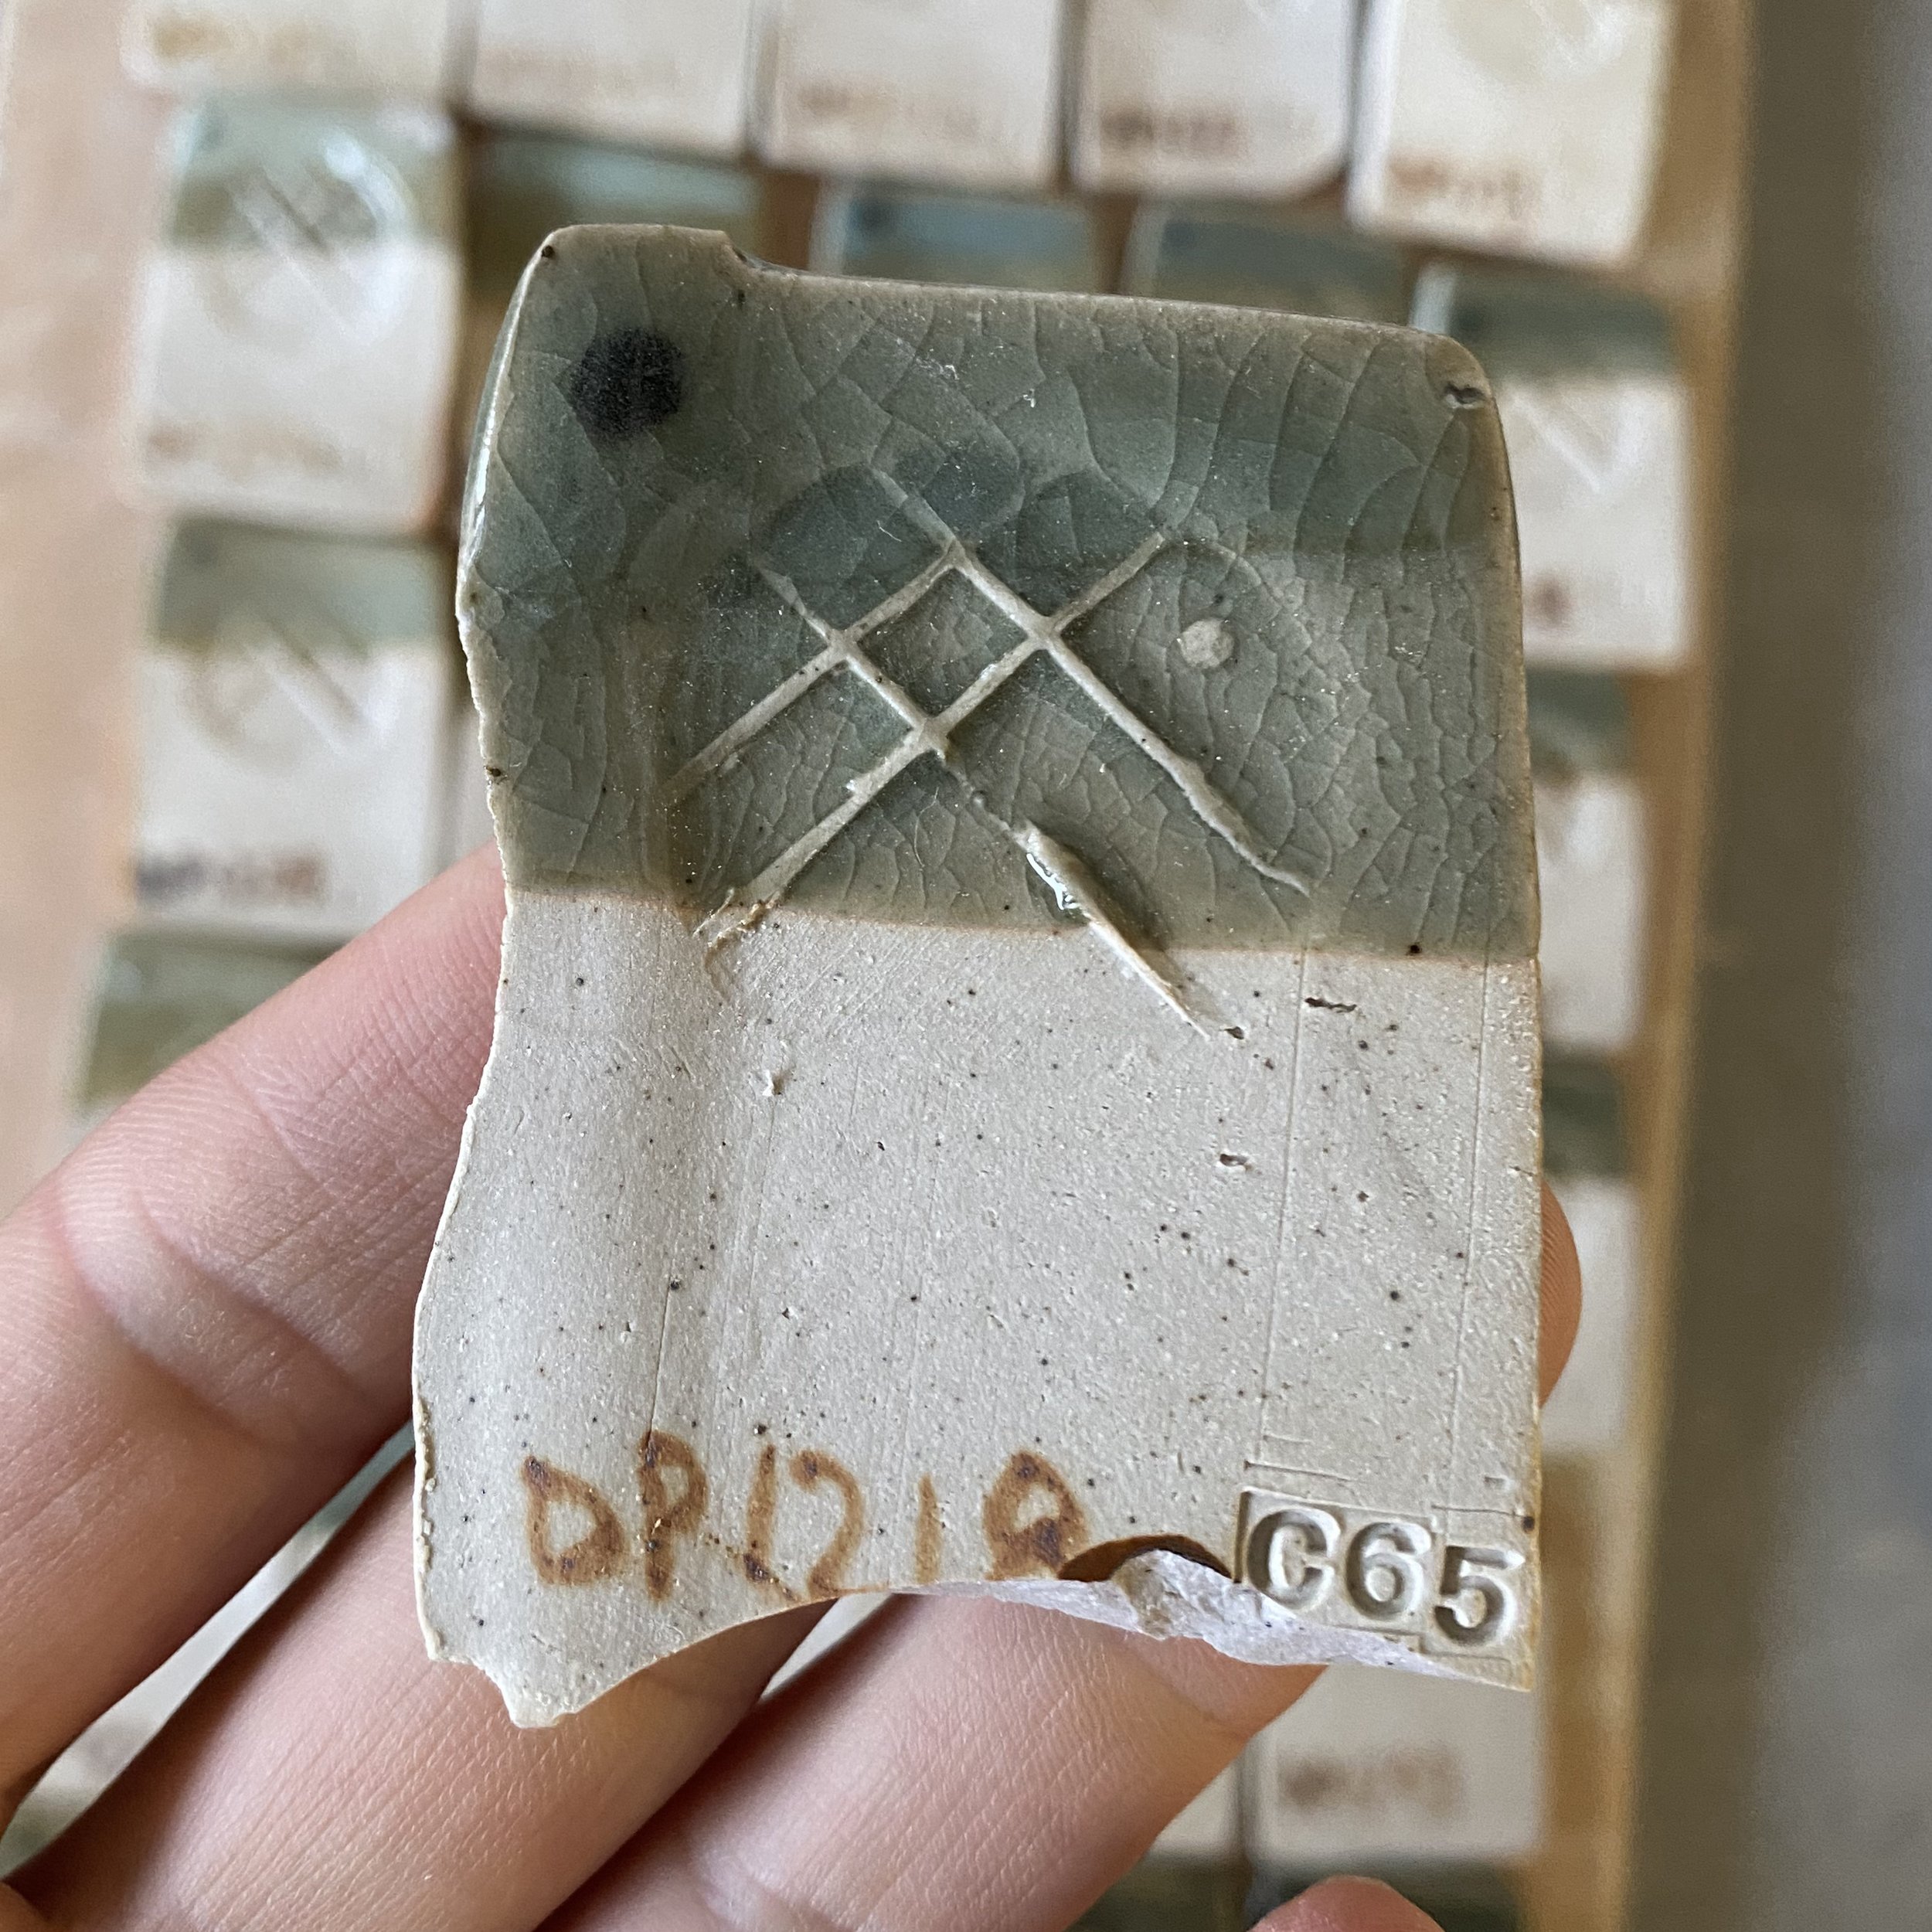
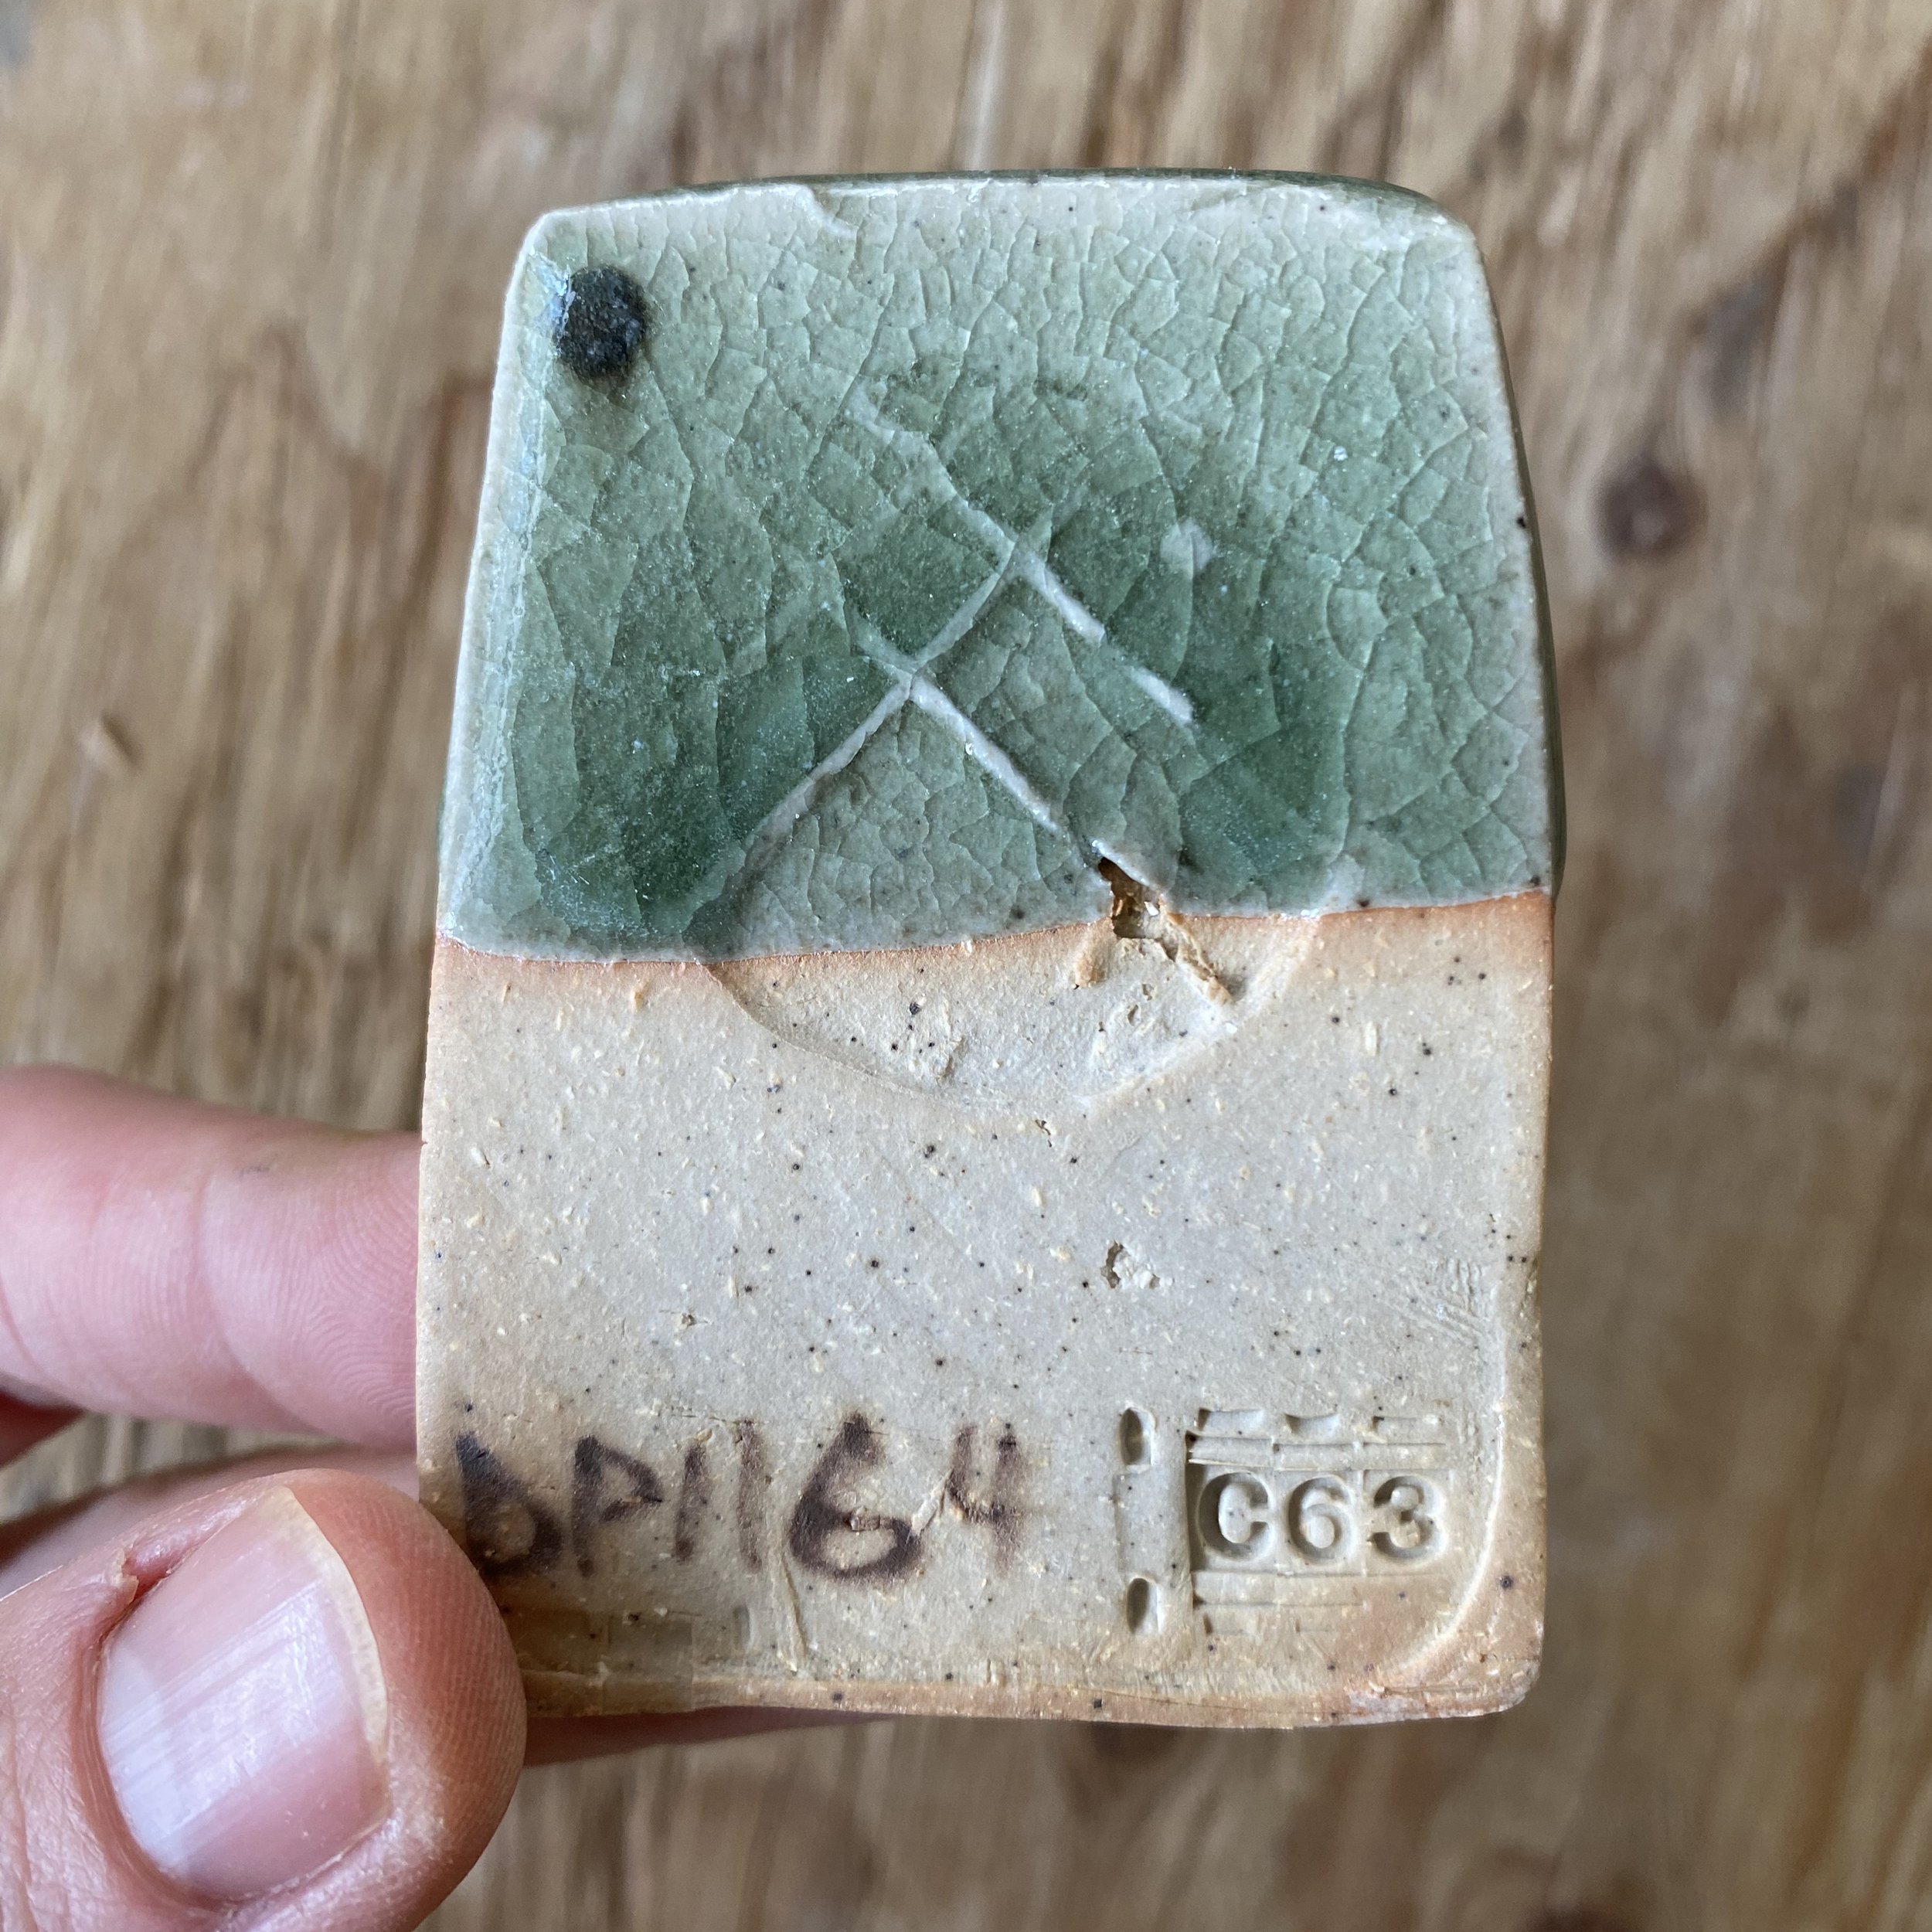
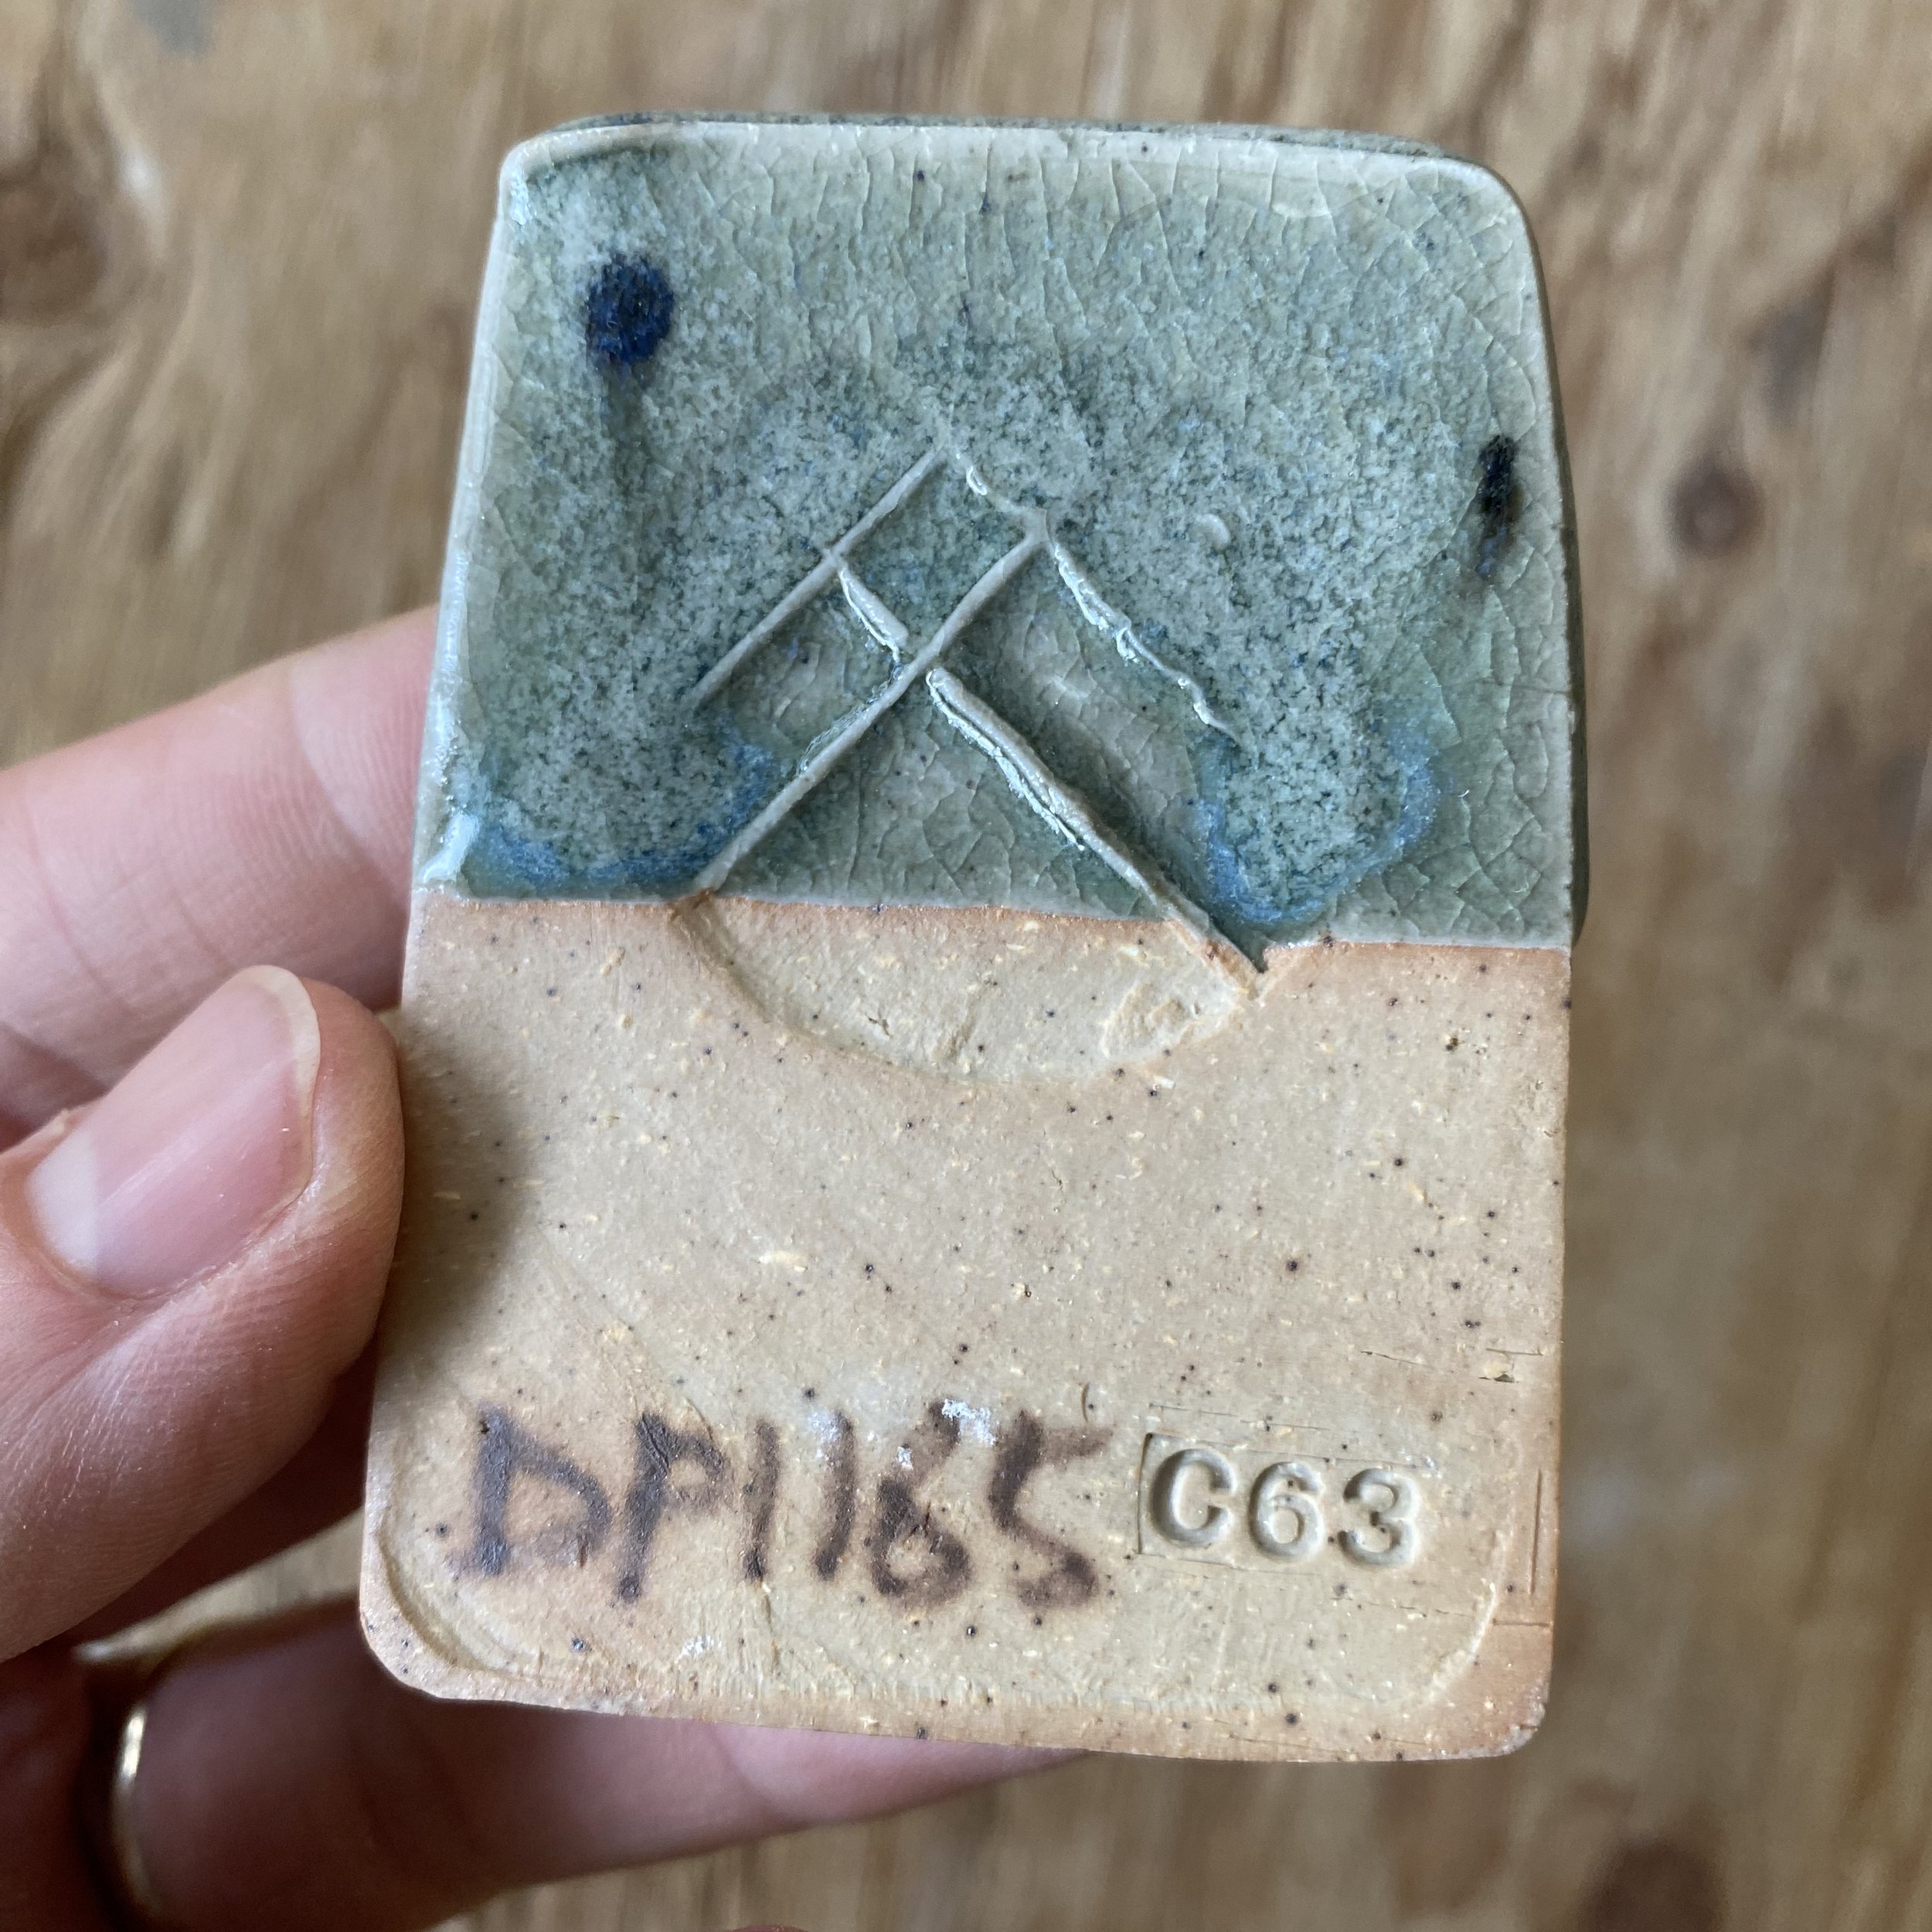
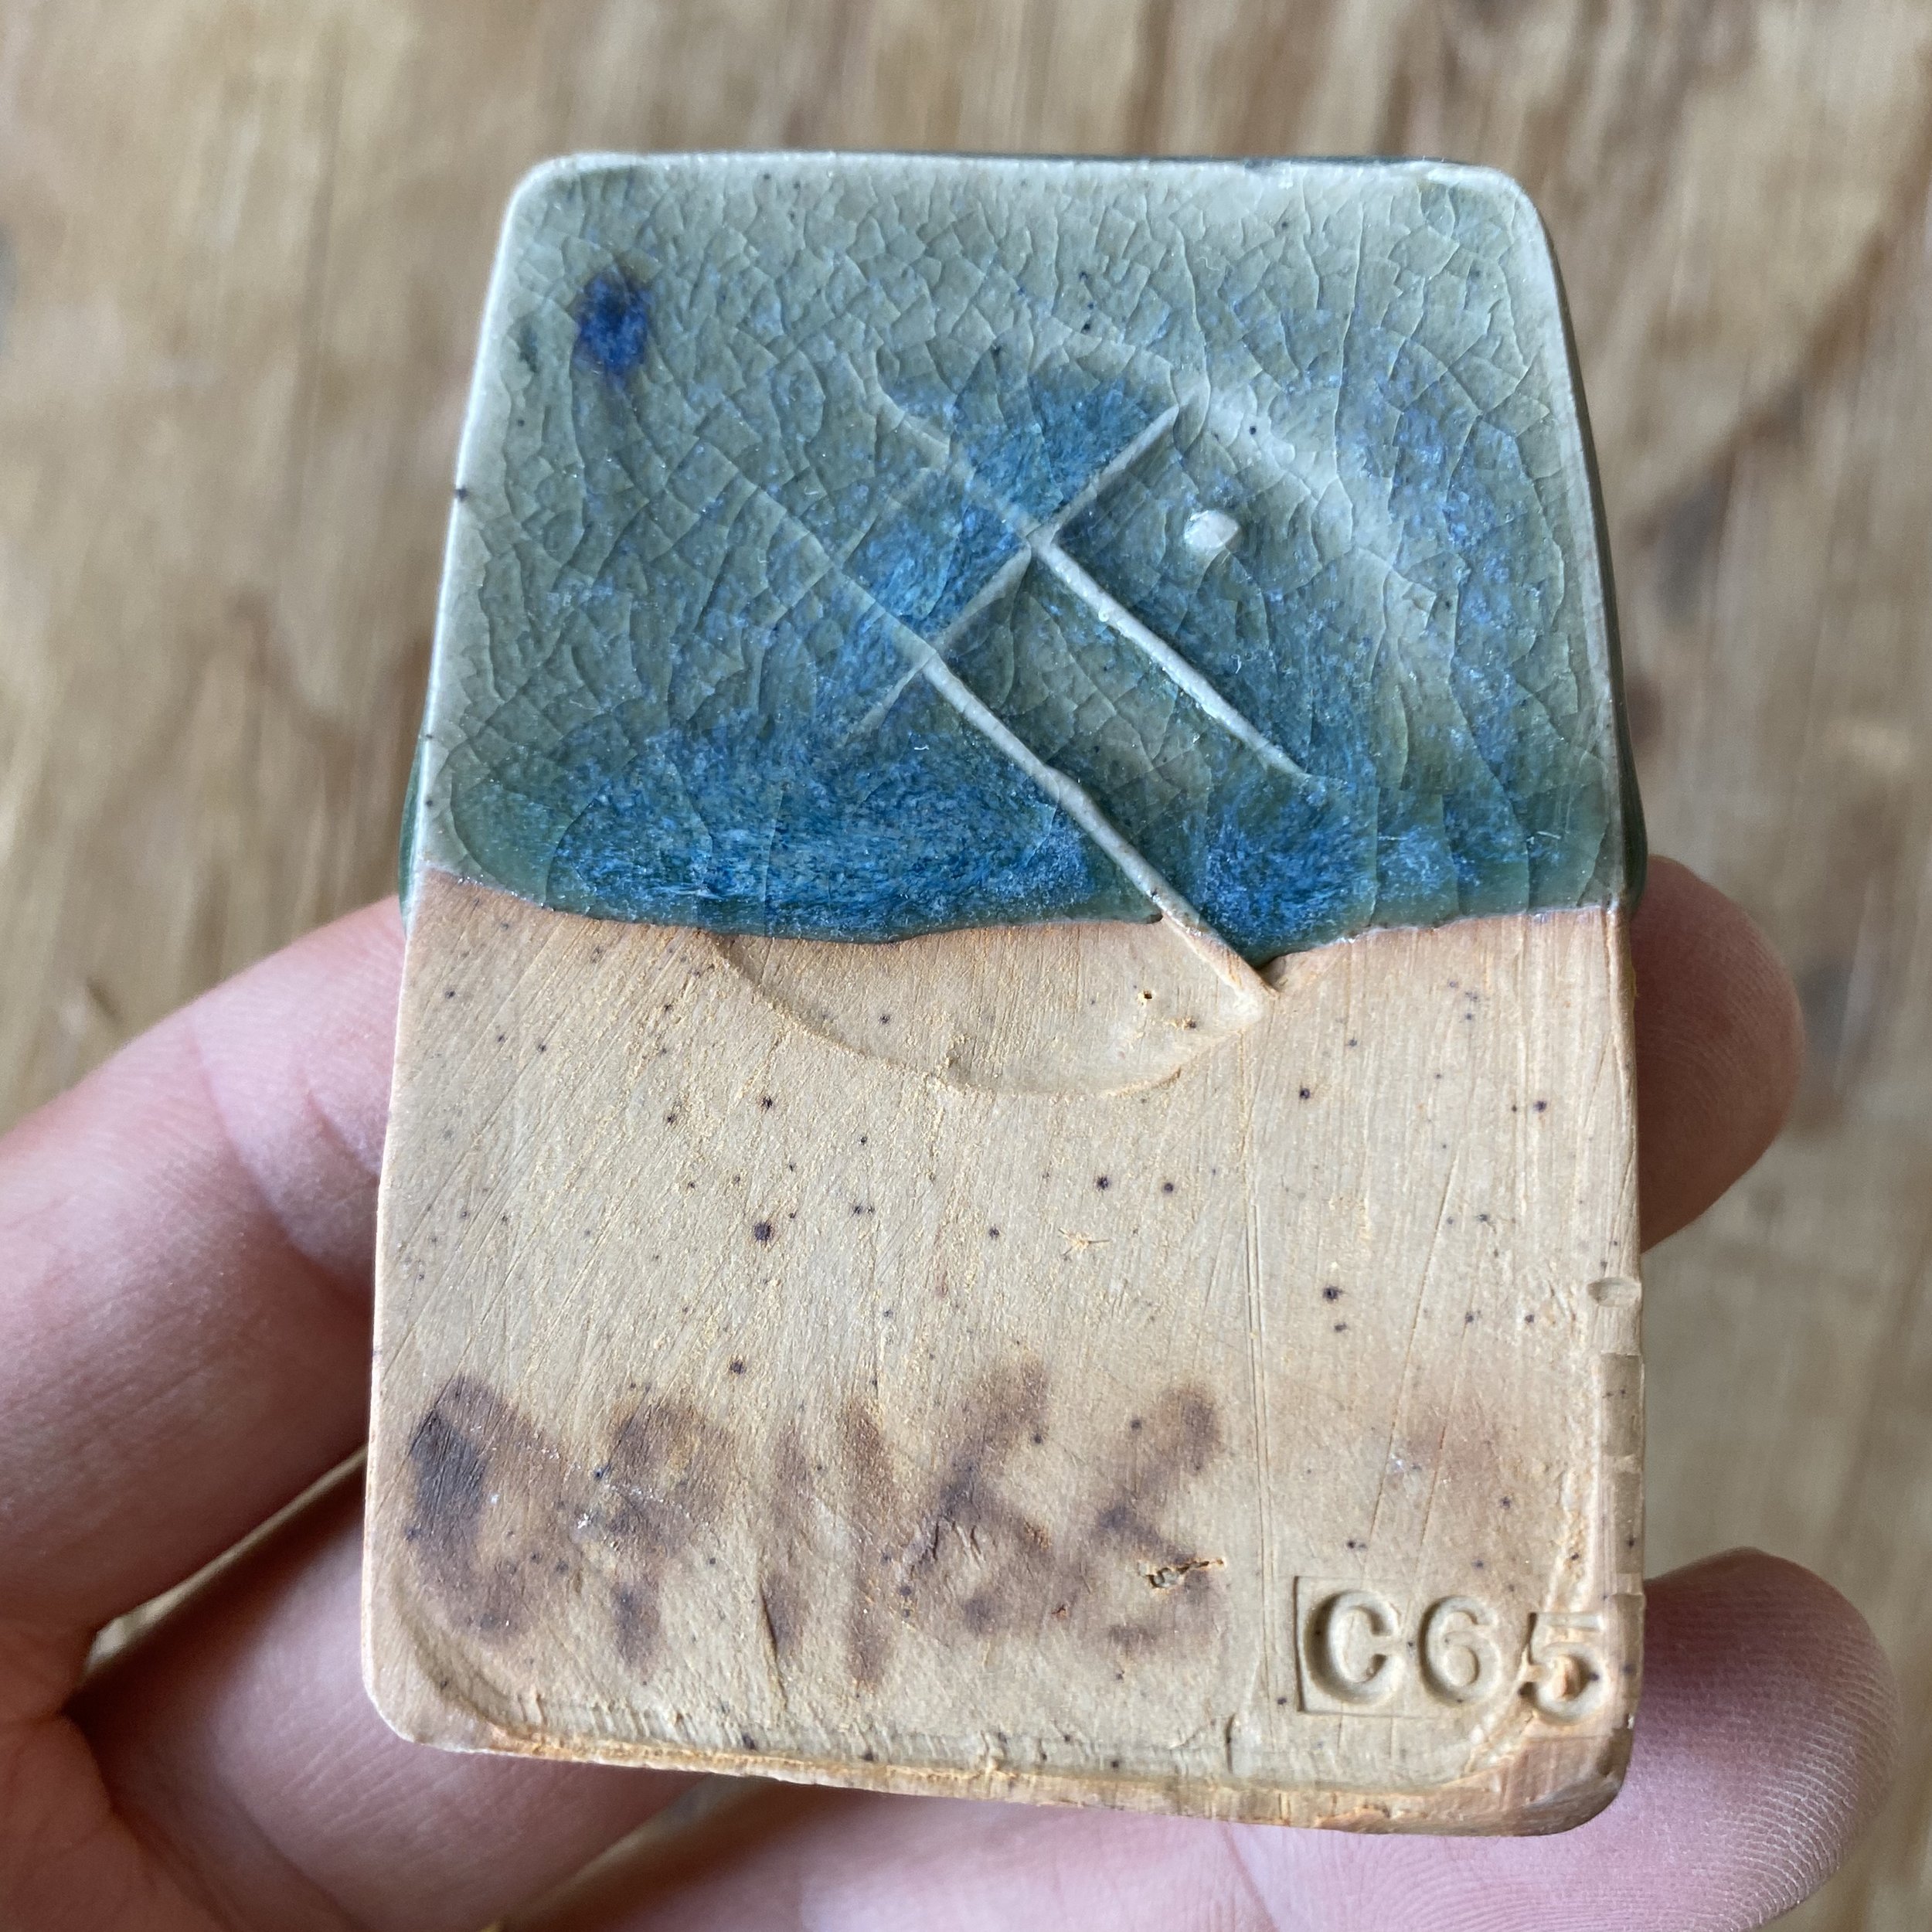
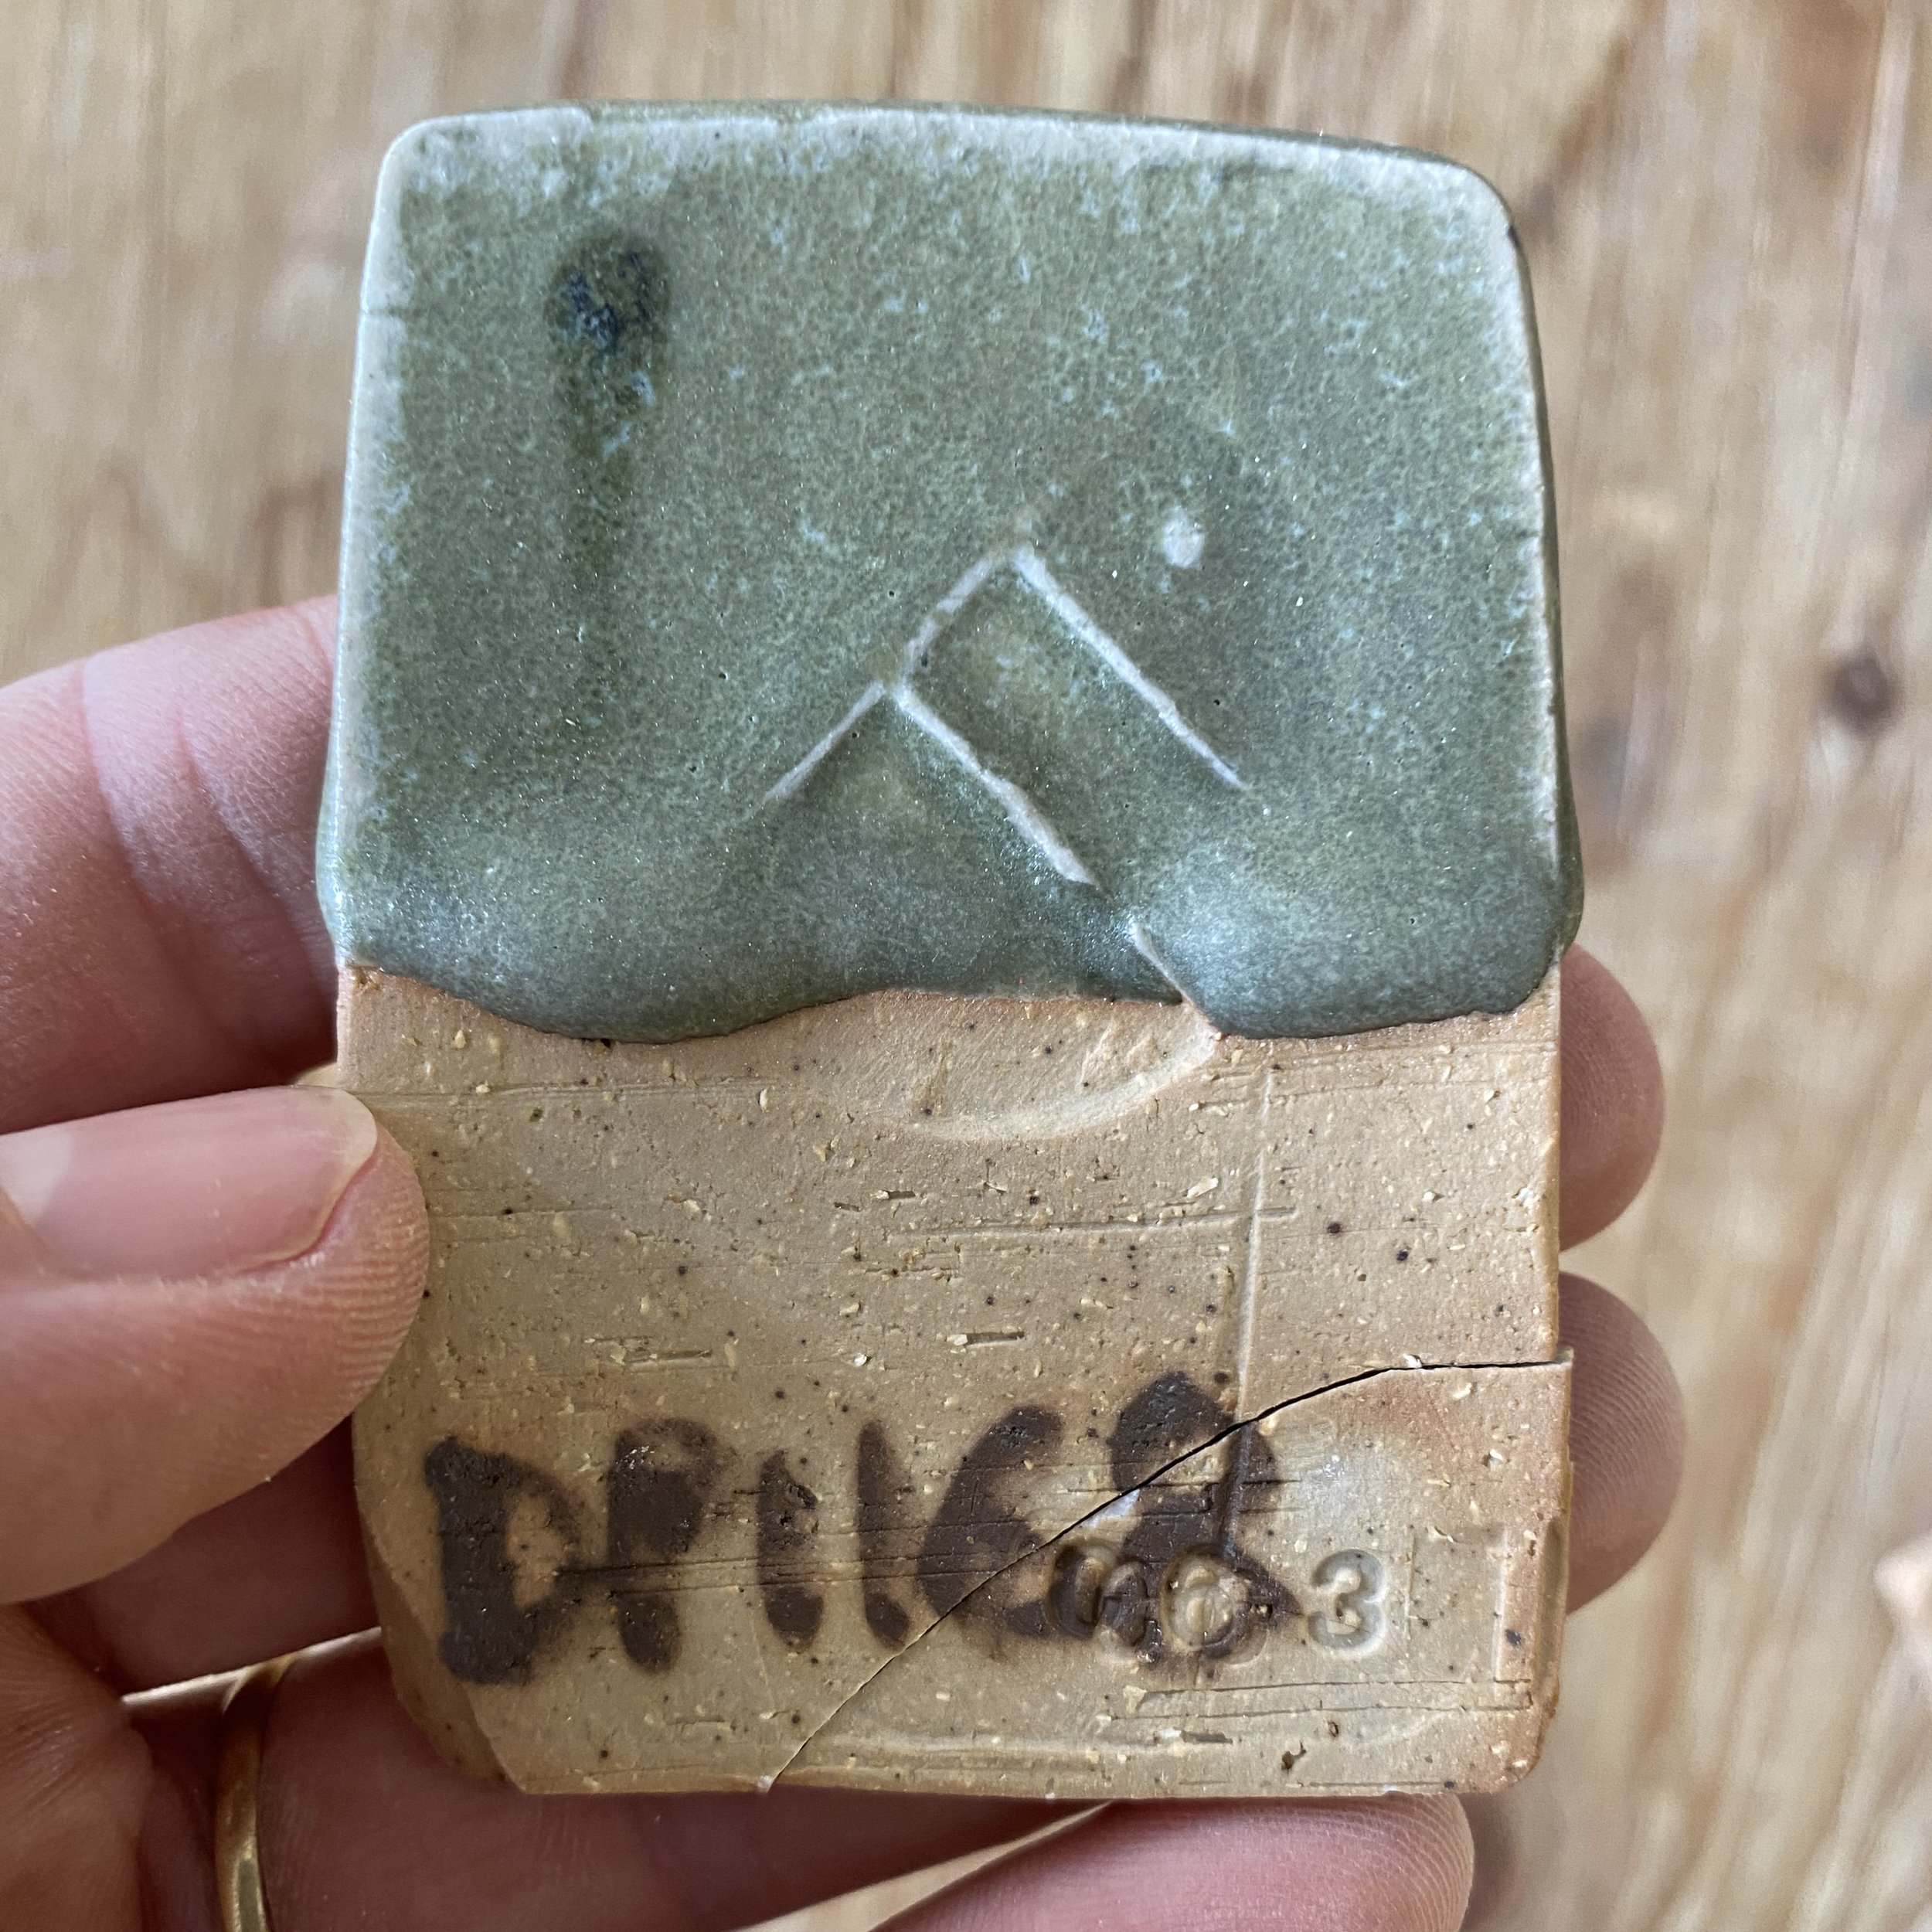
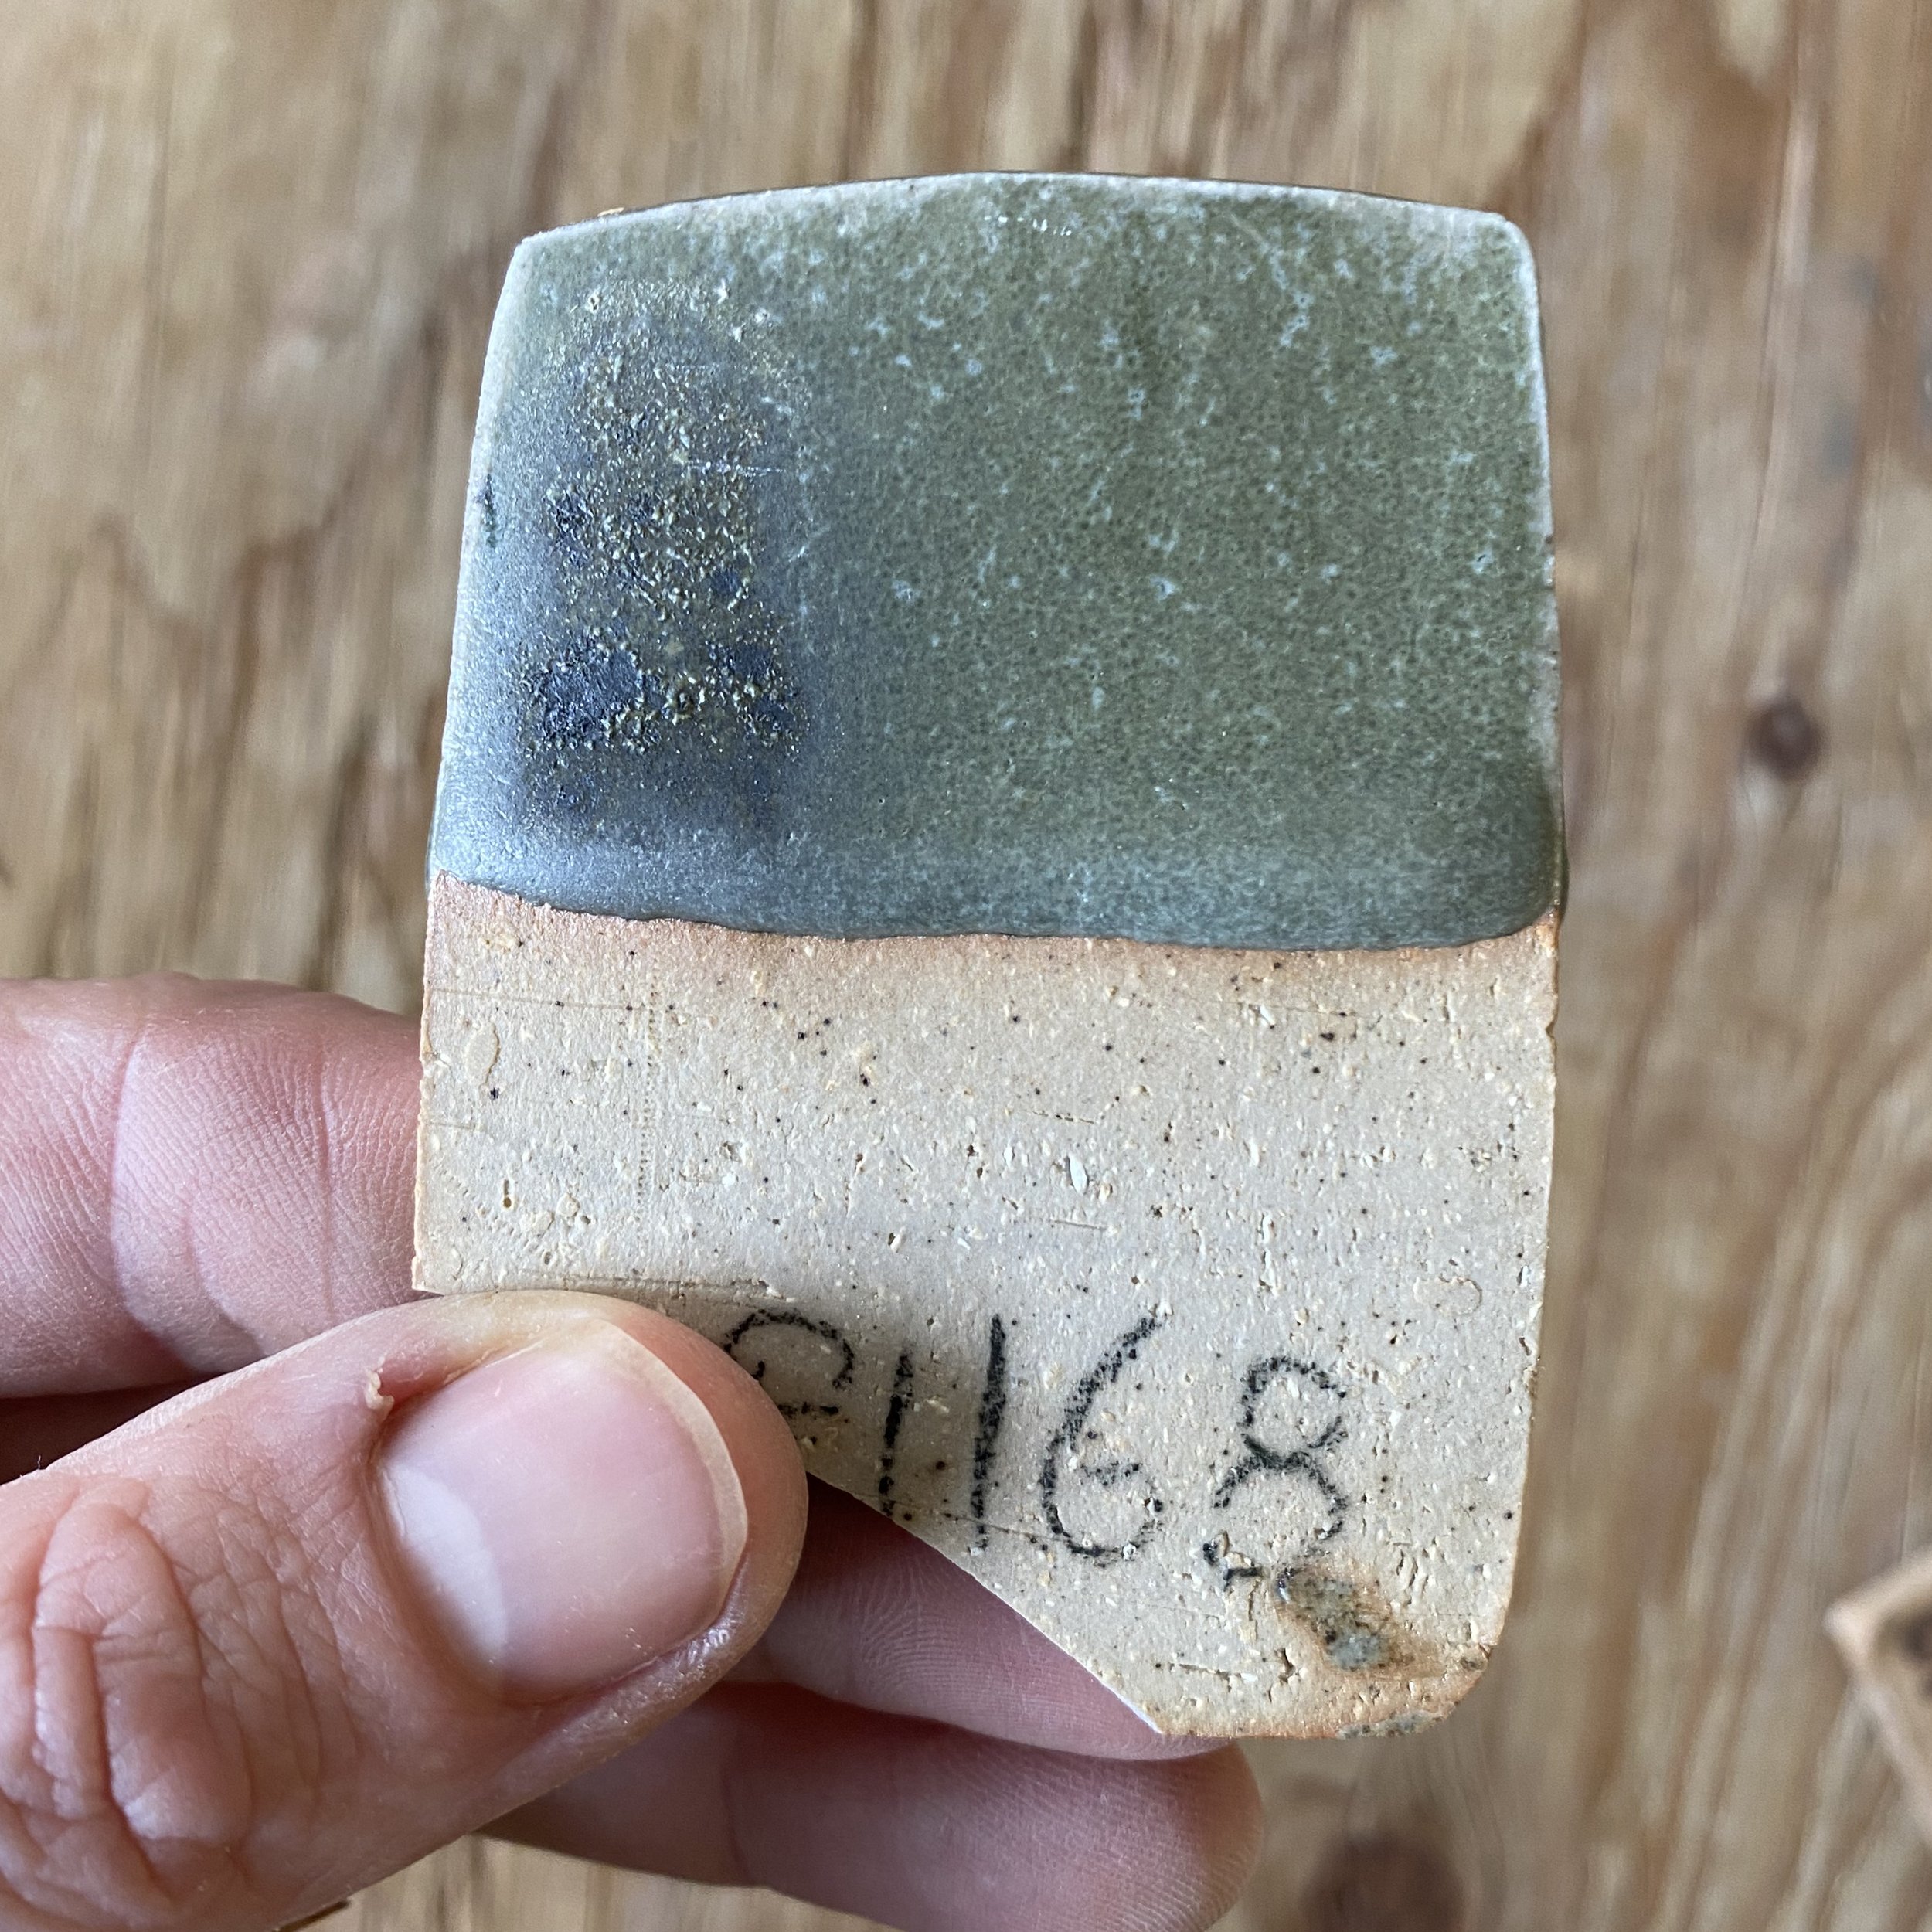
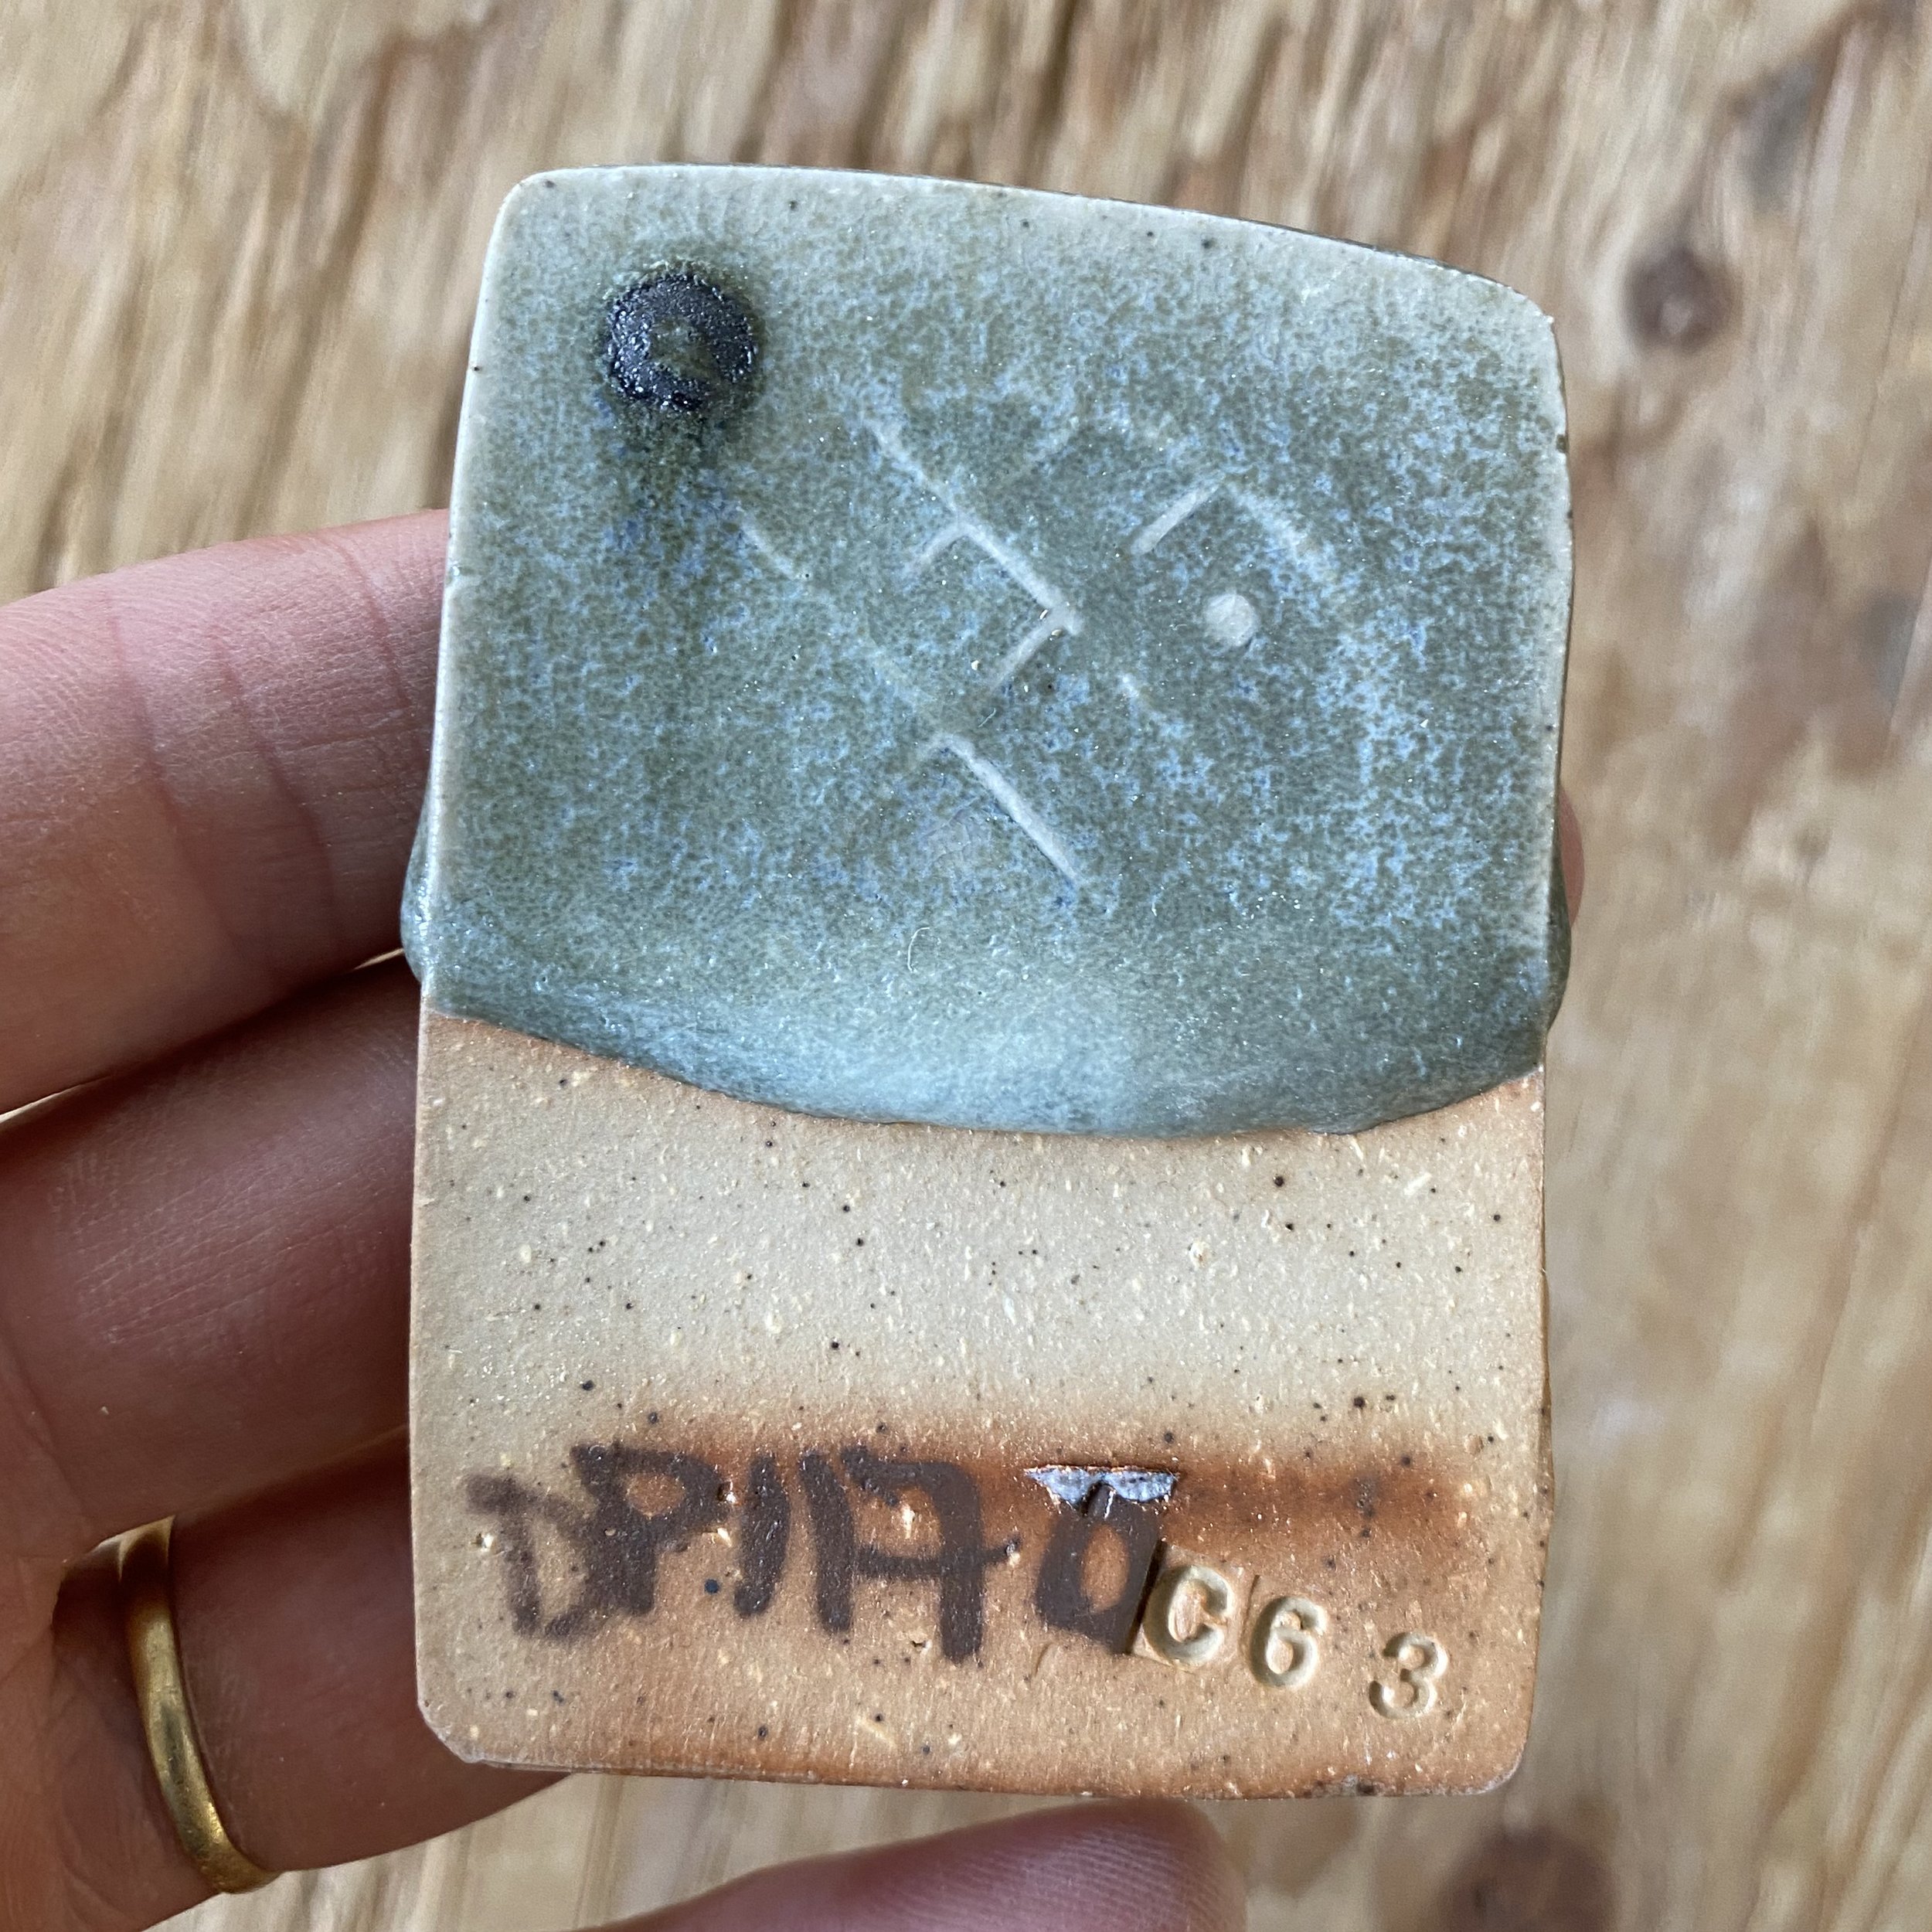
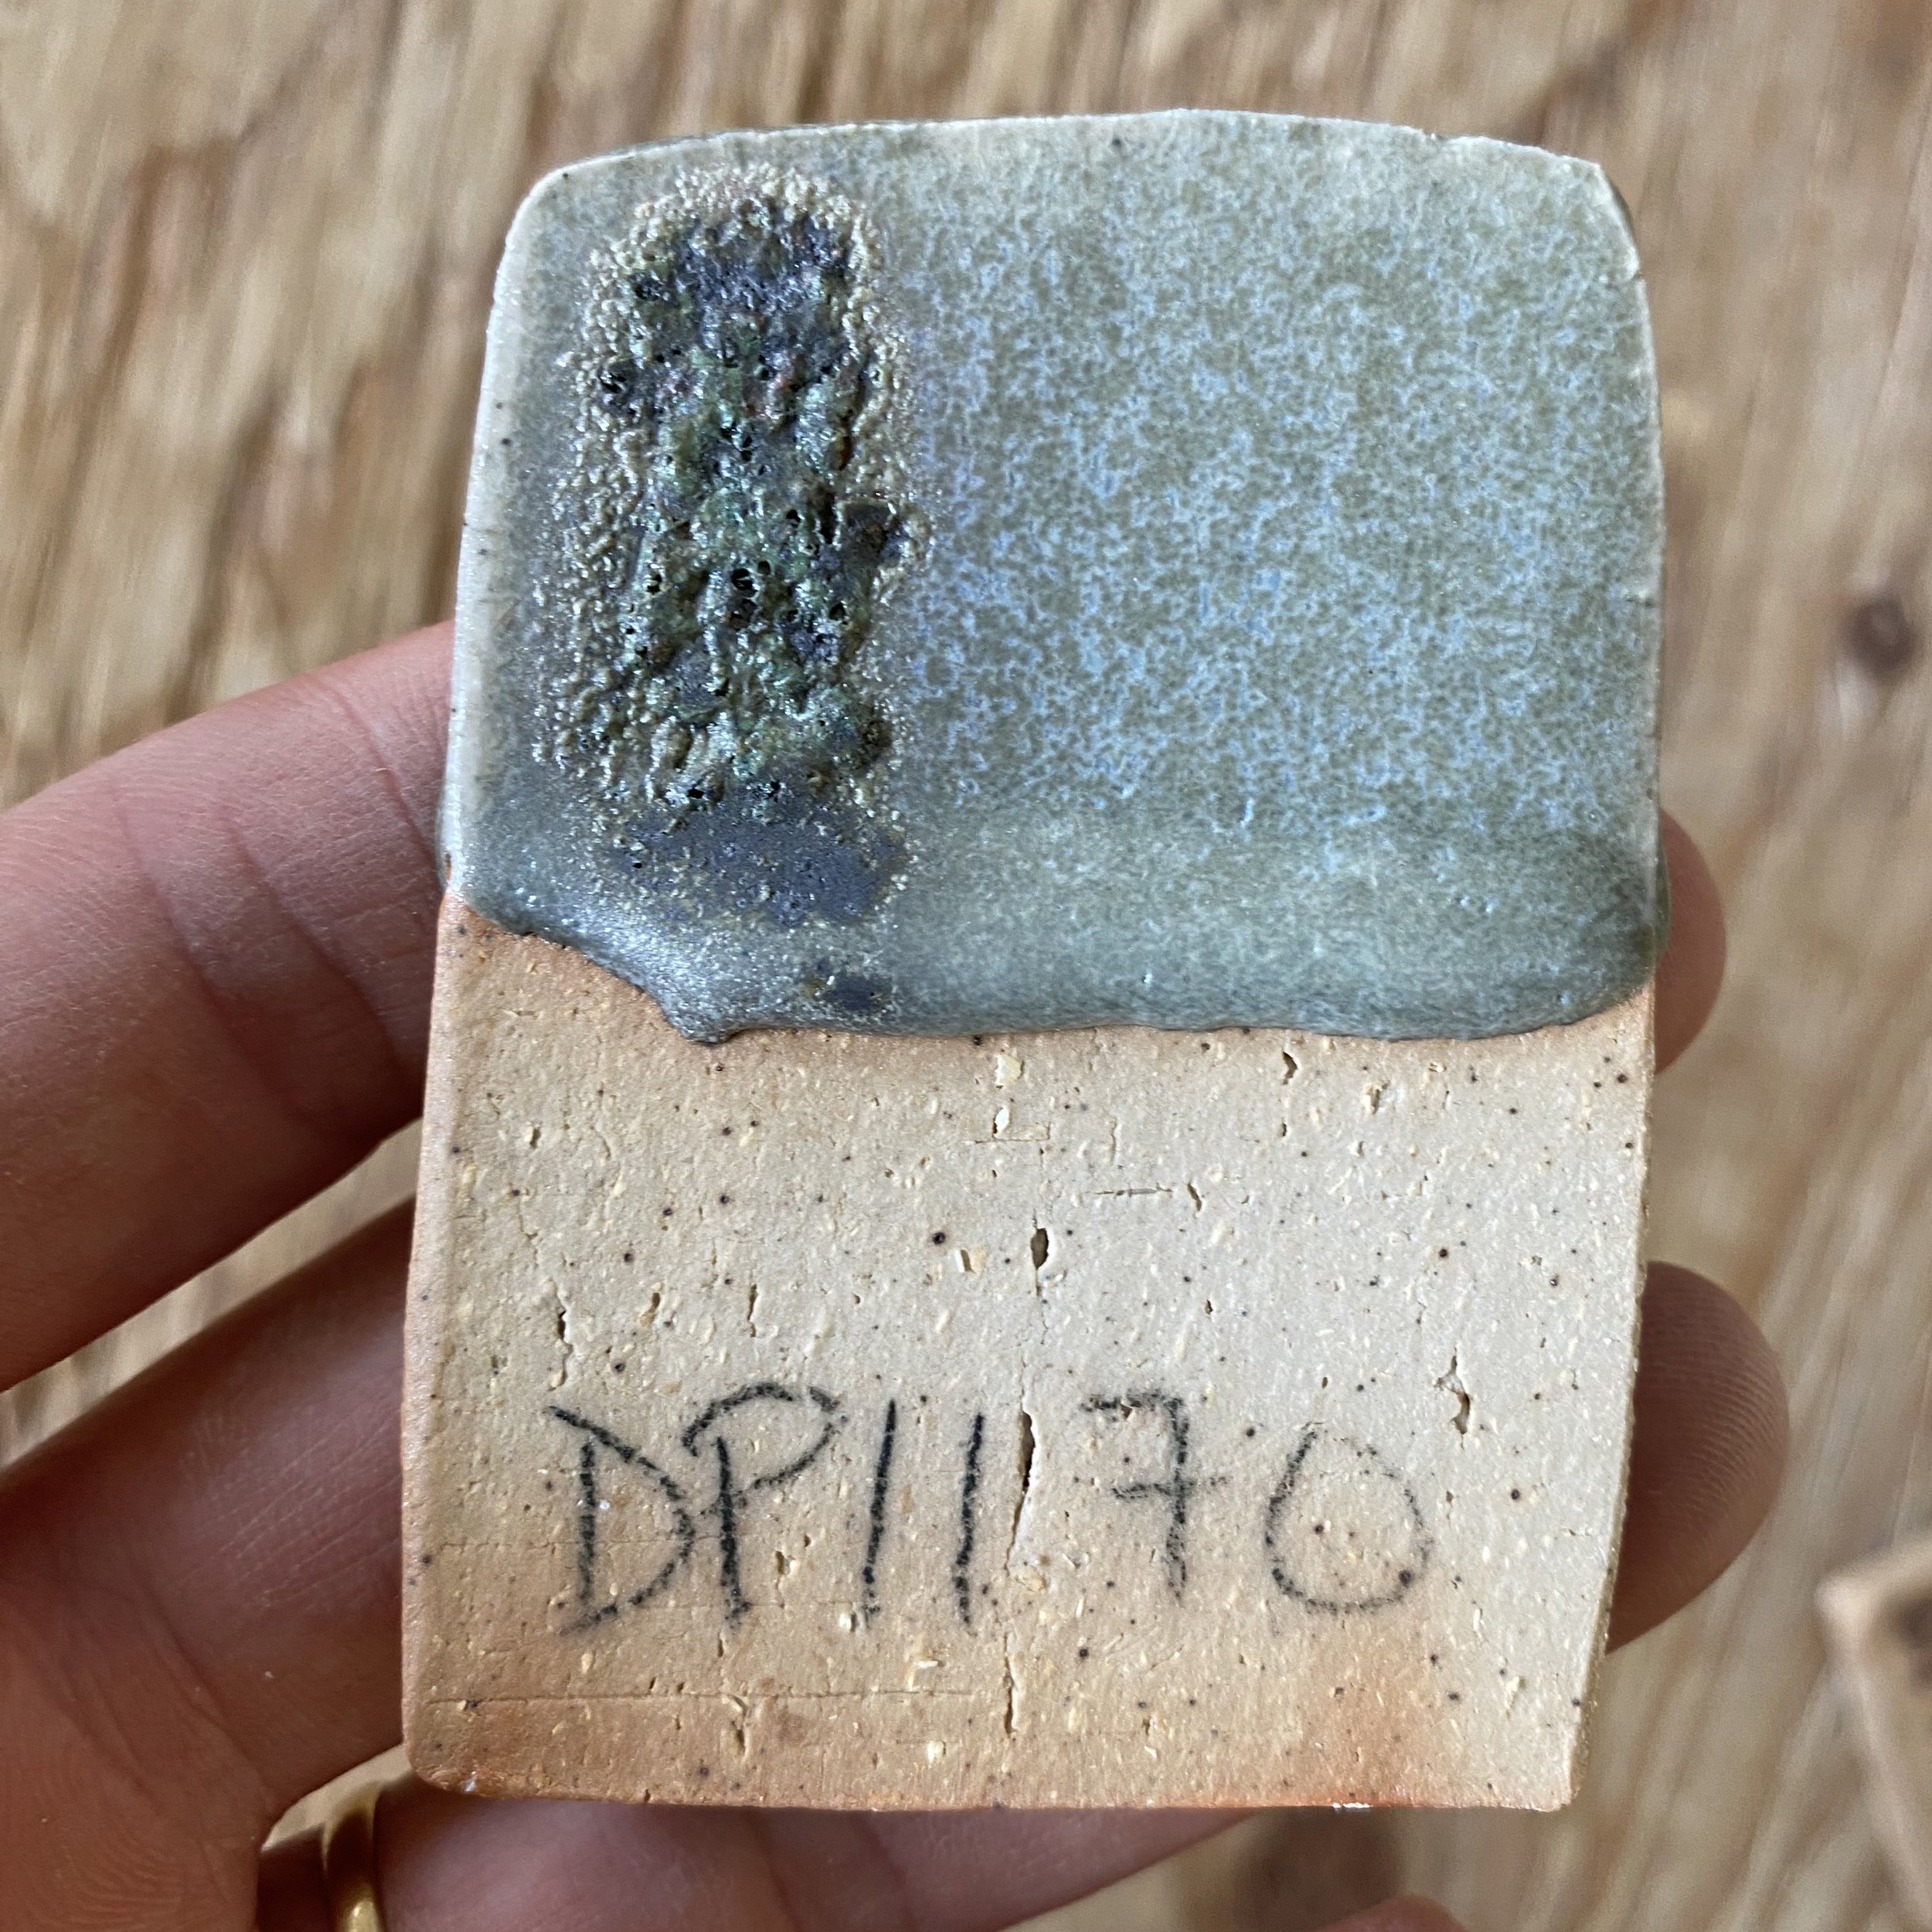
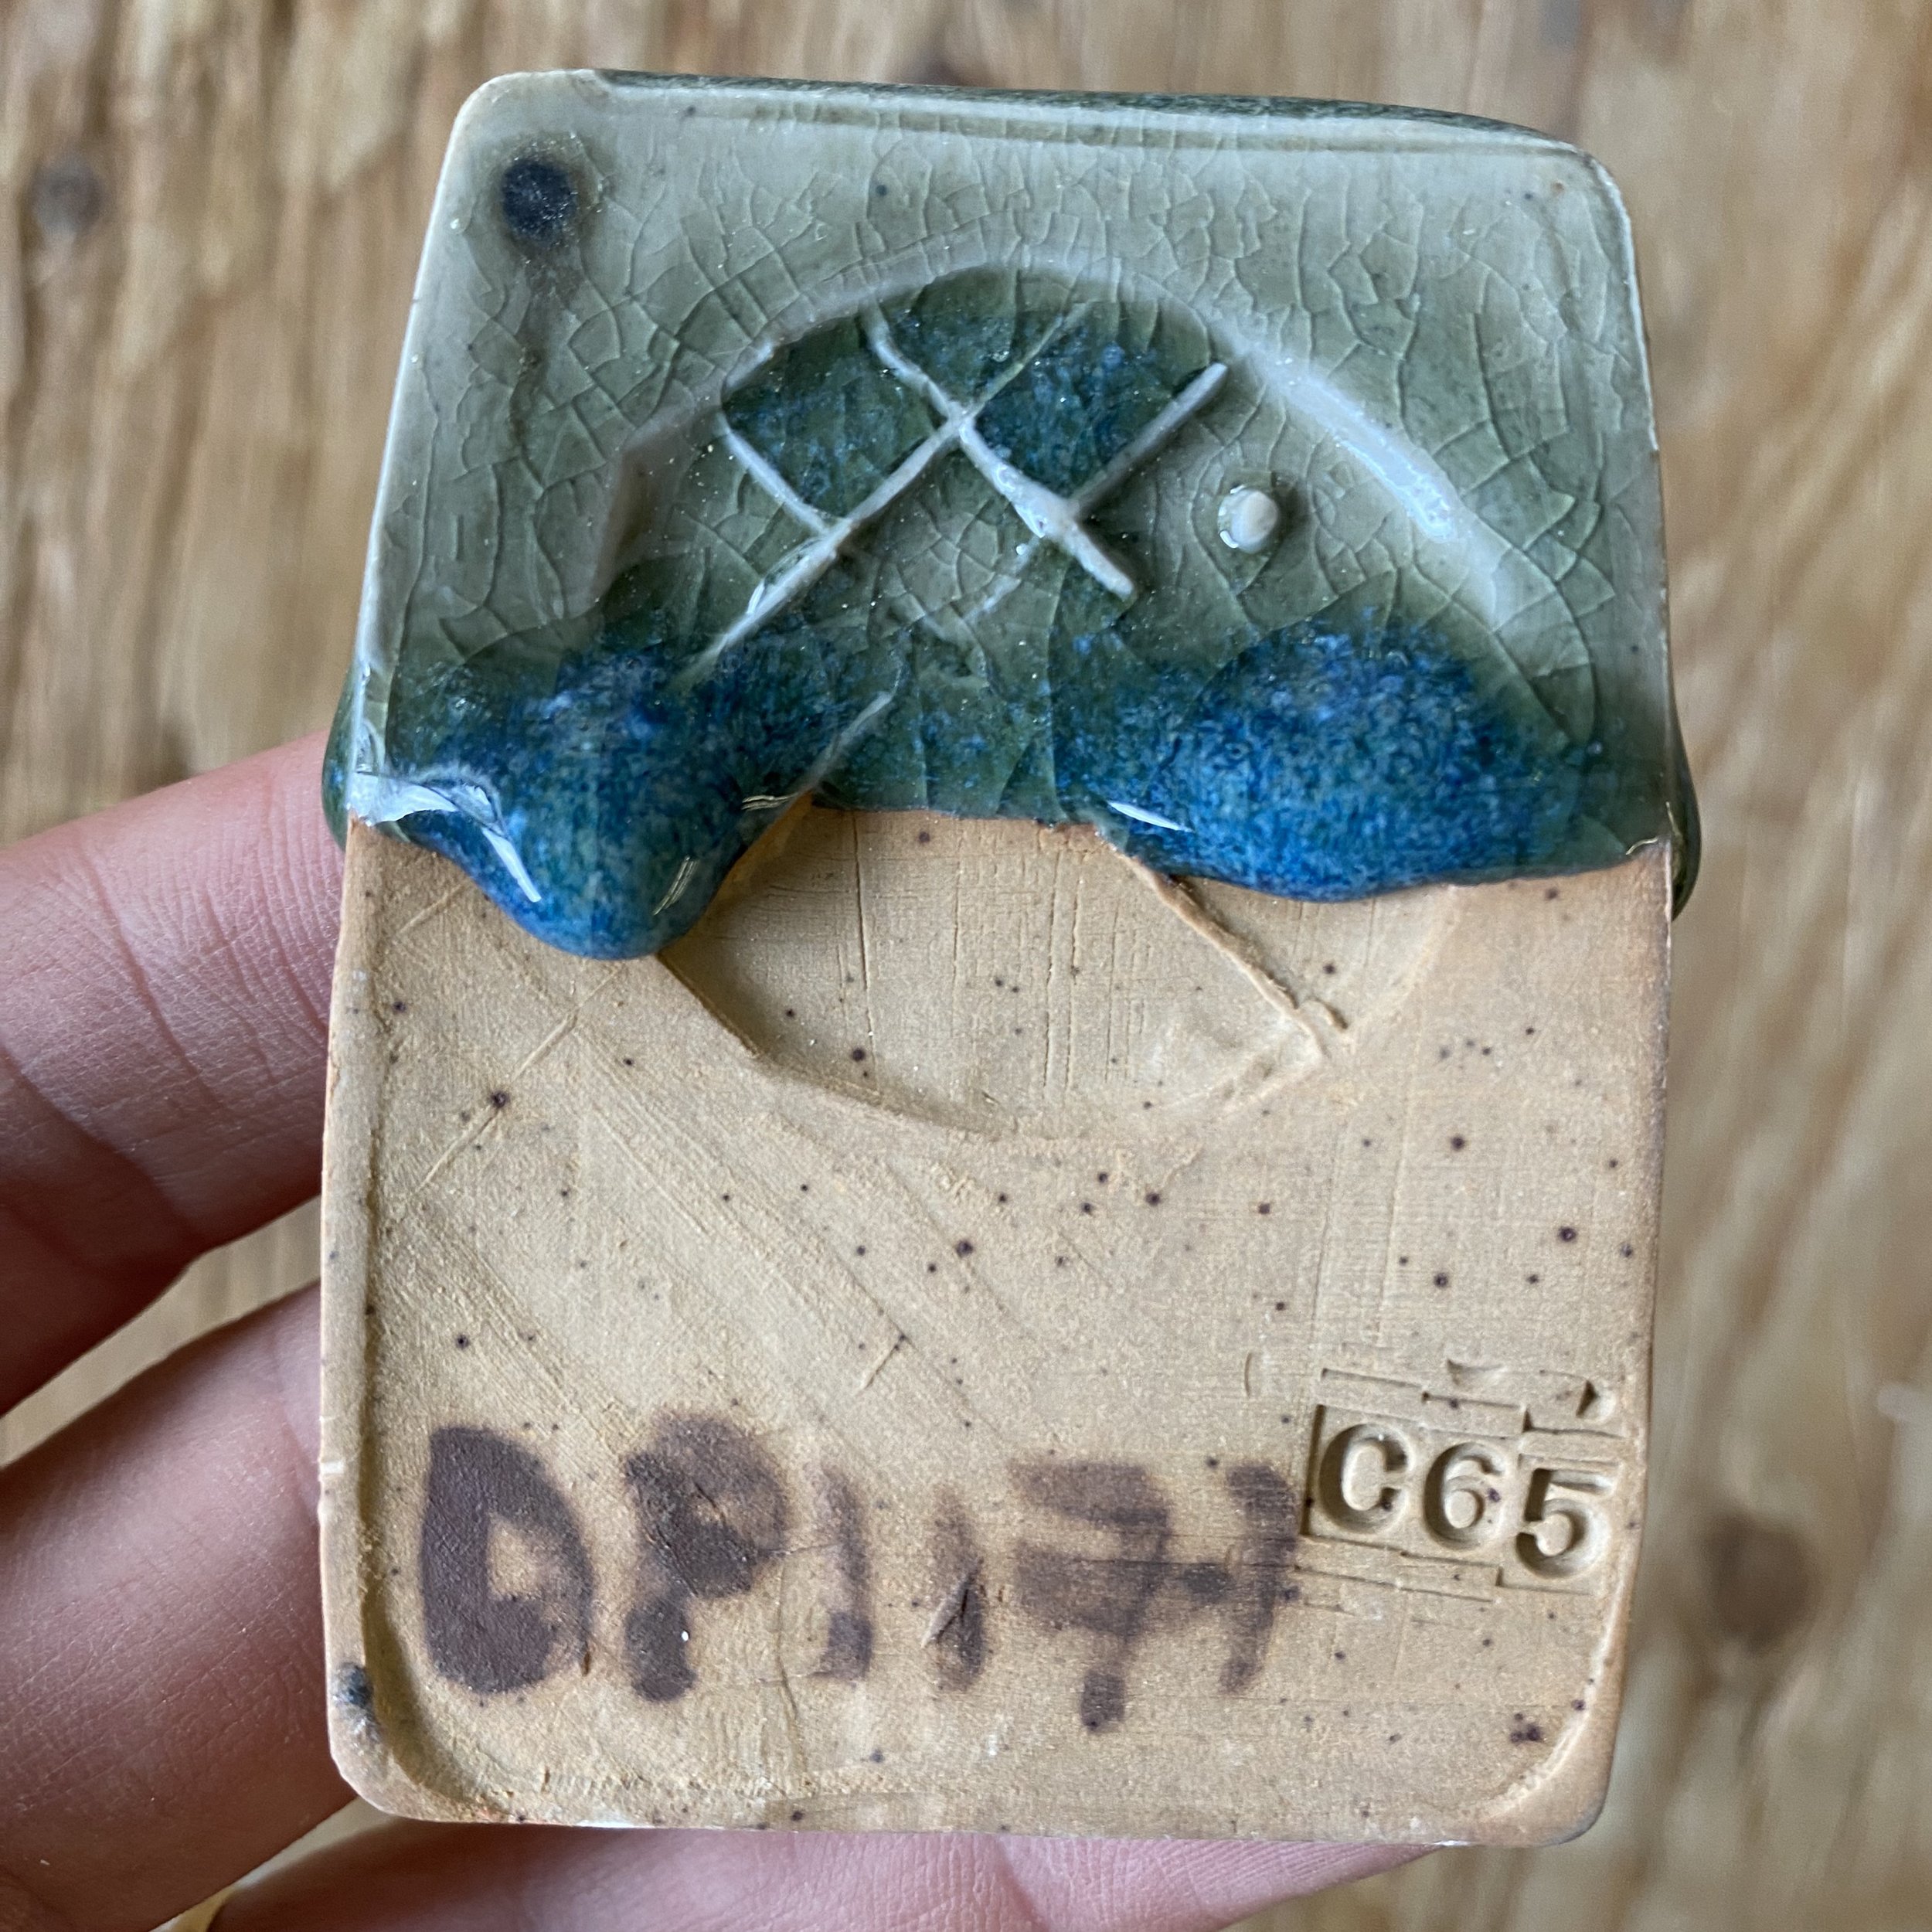
Here are the tests individually (click to enlarge). Front side:
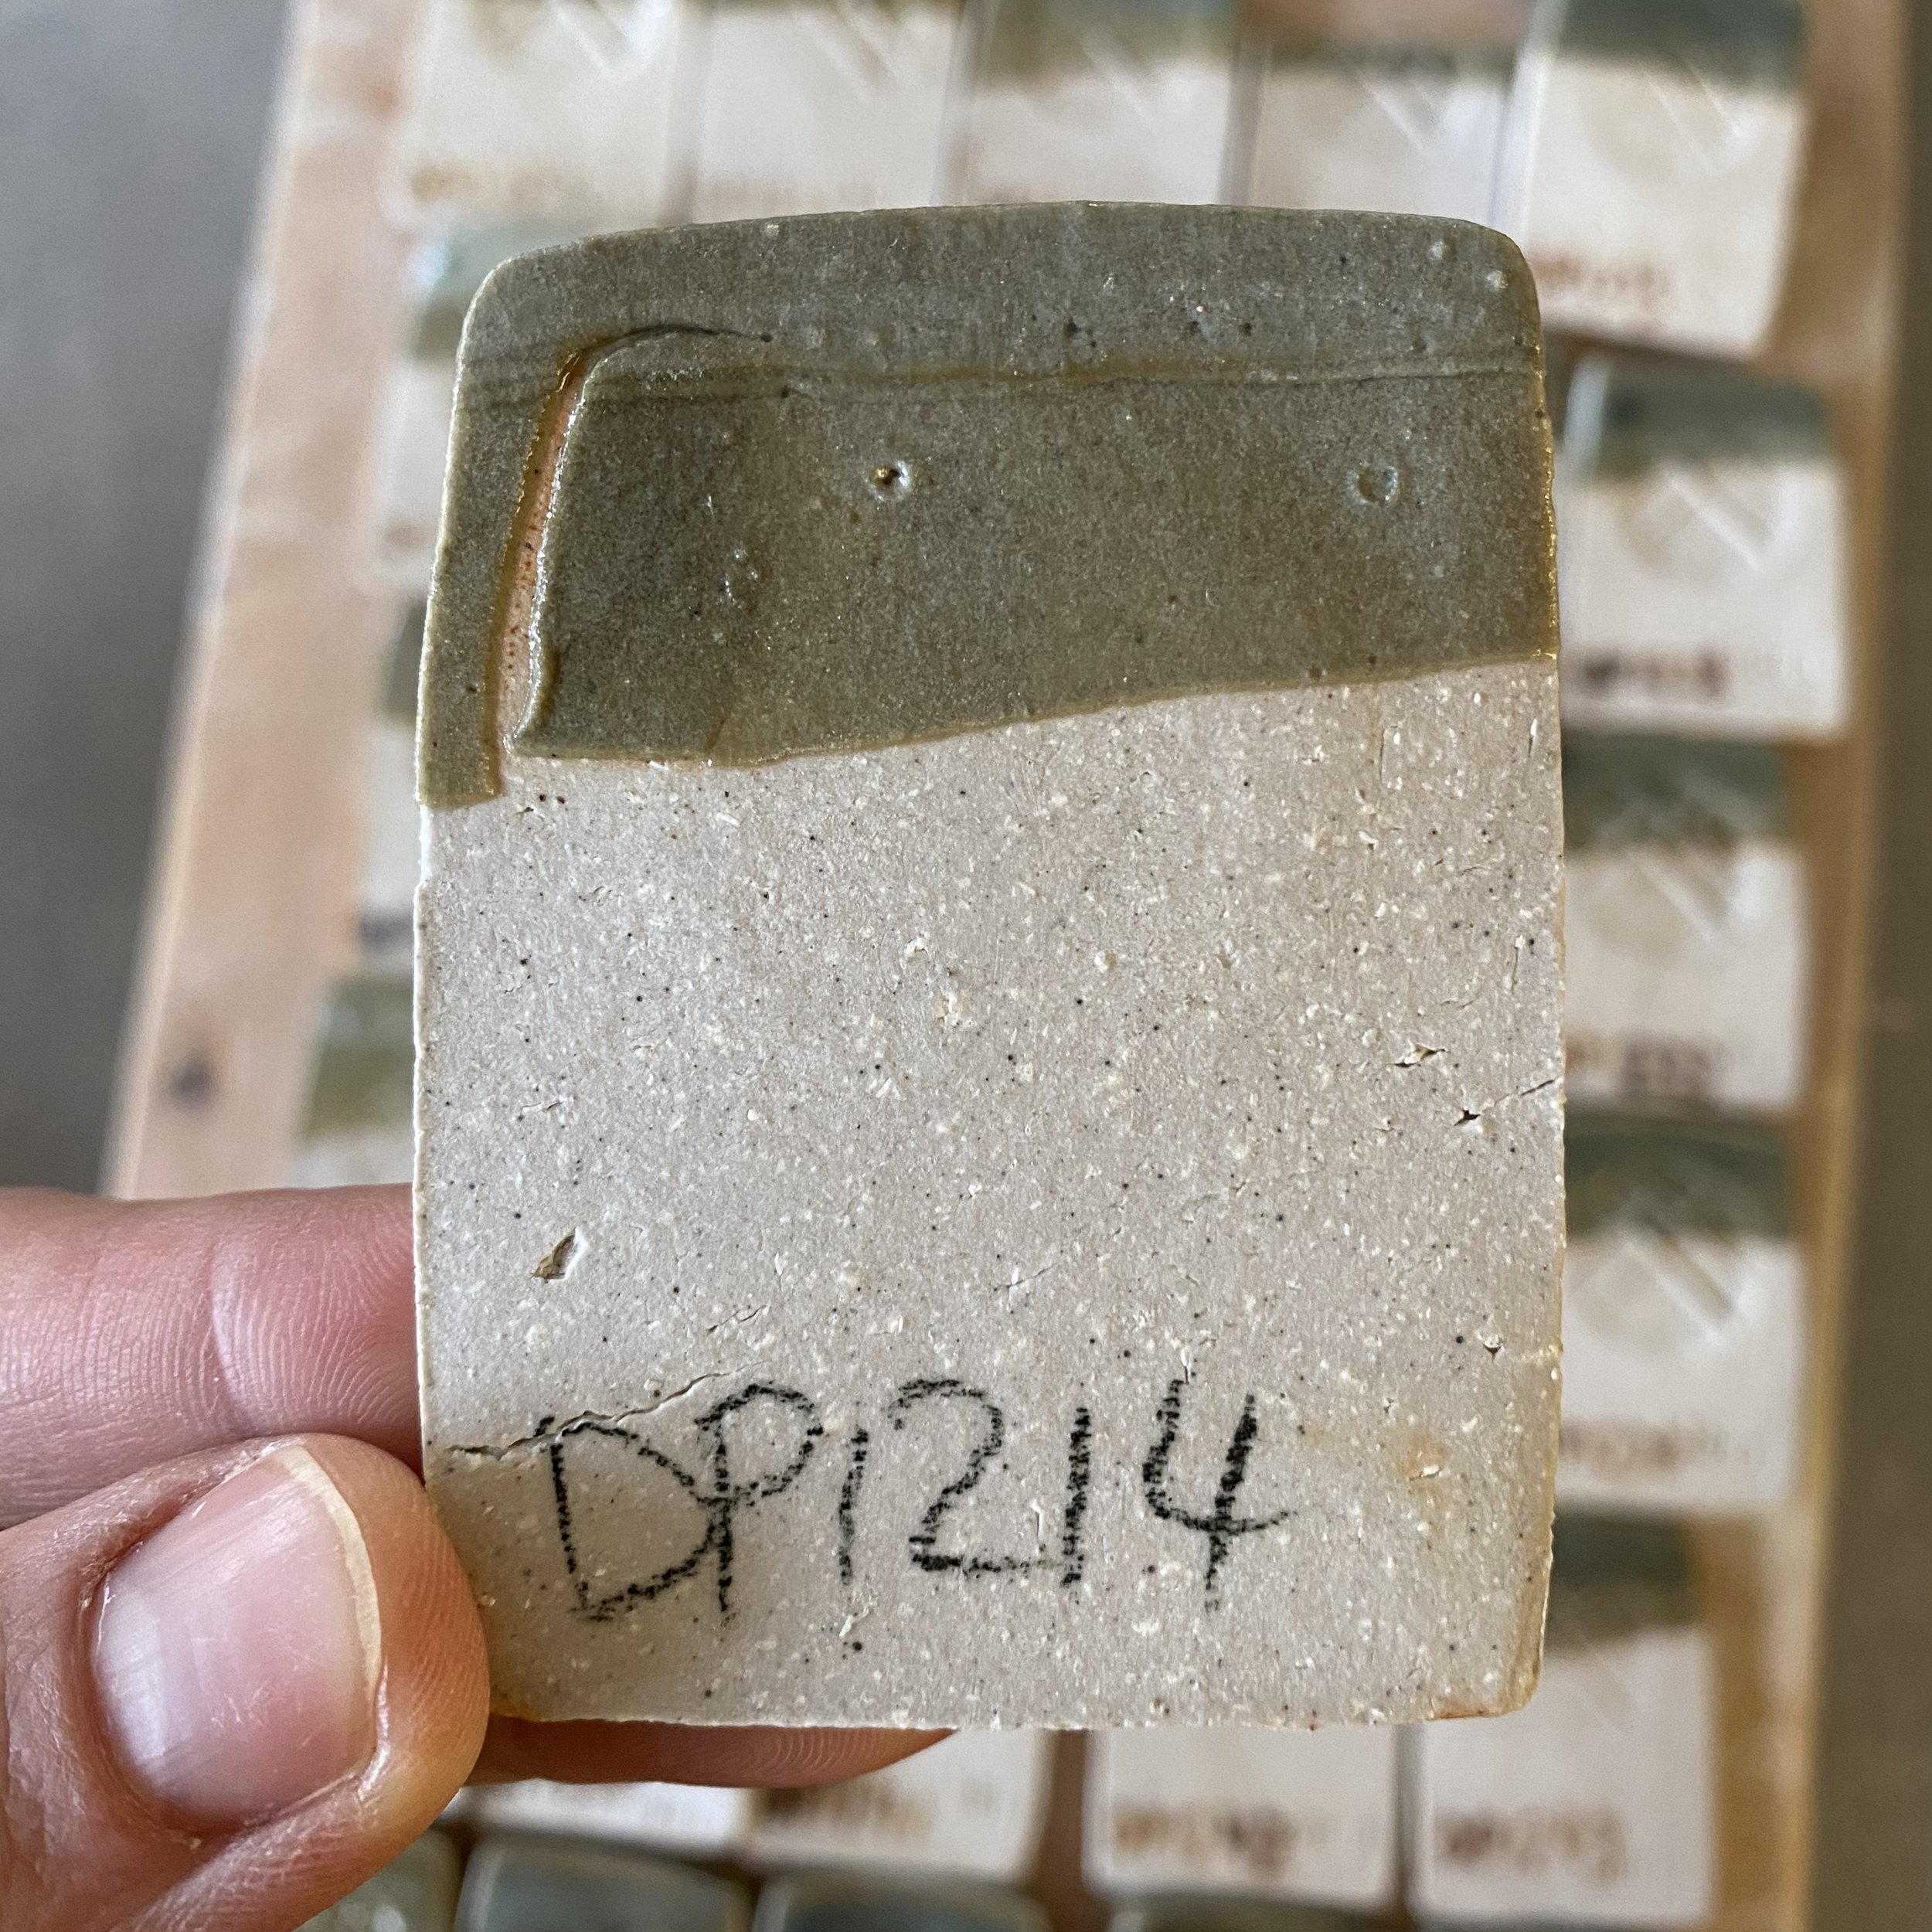
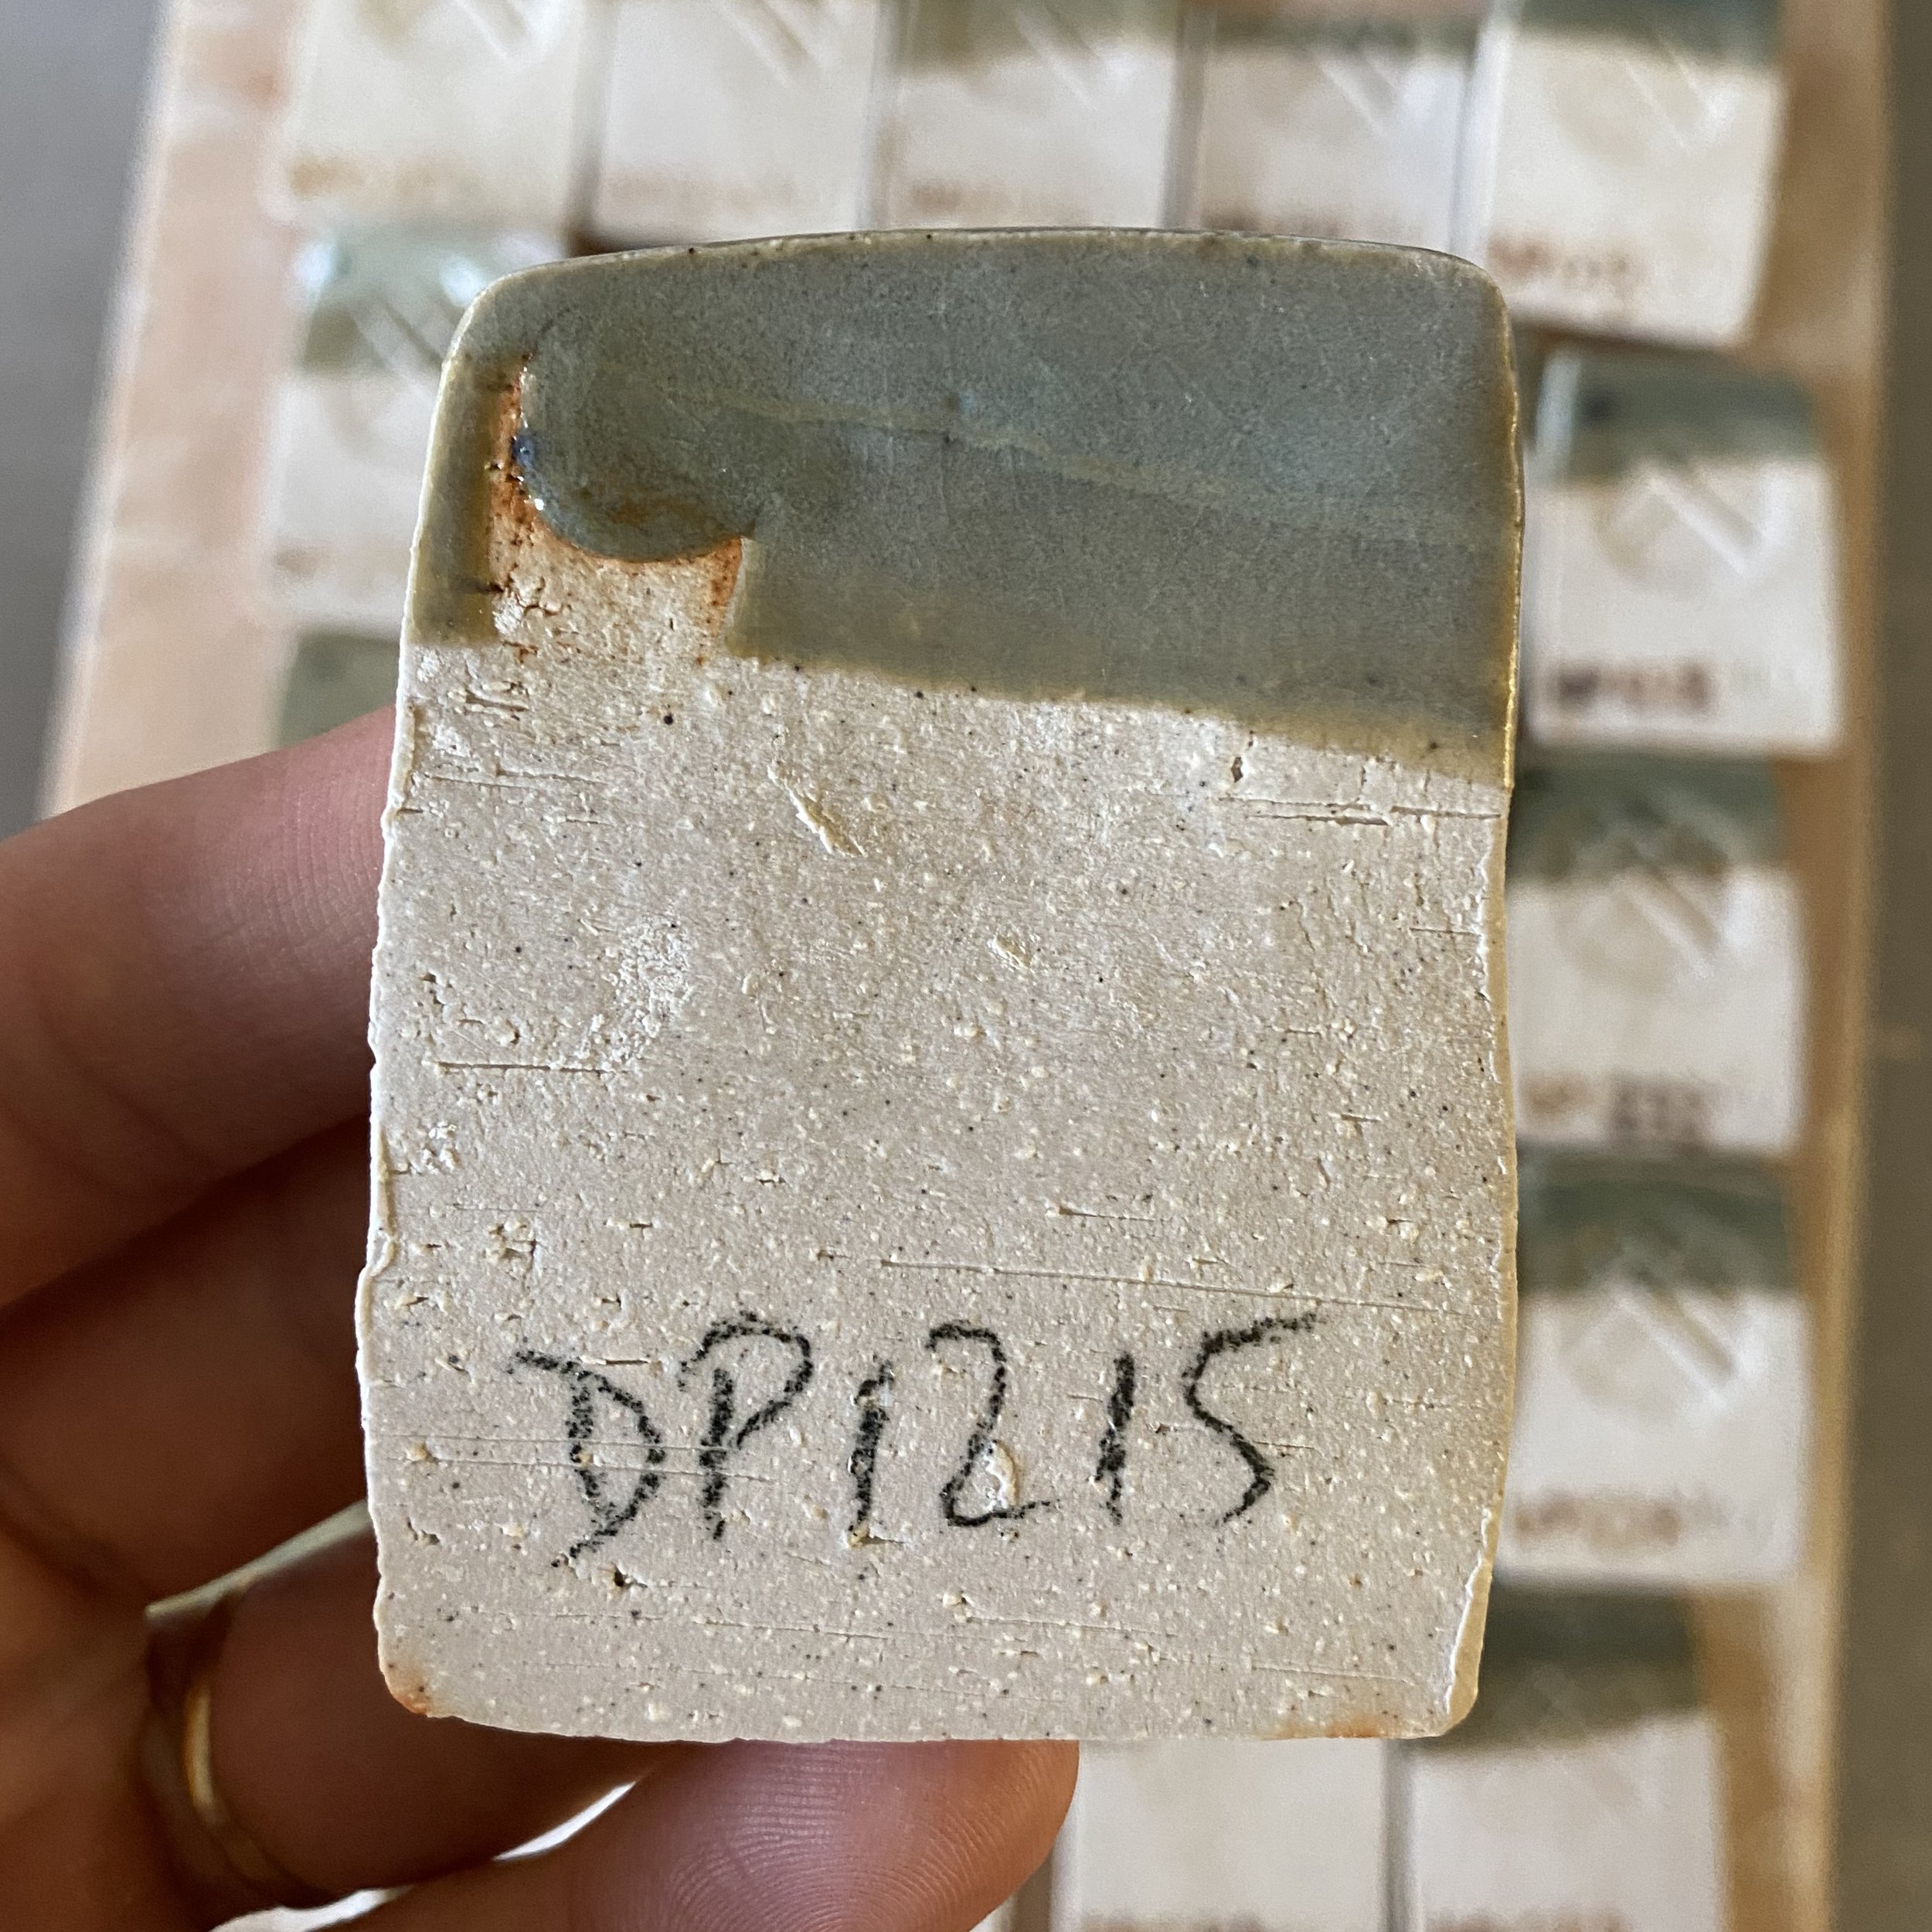
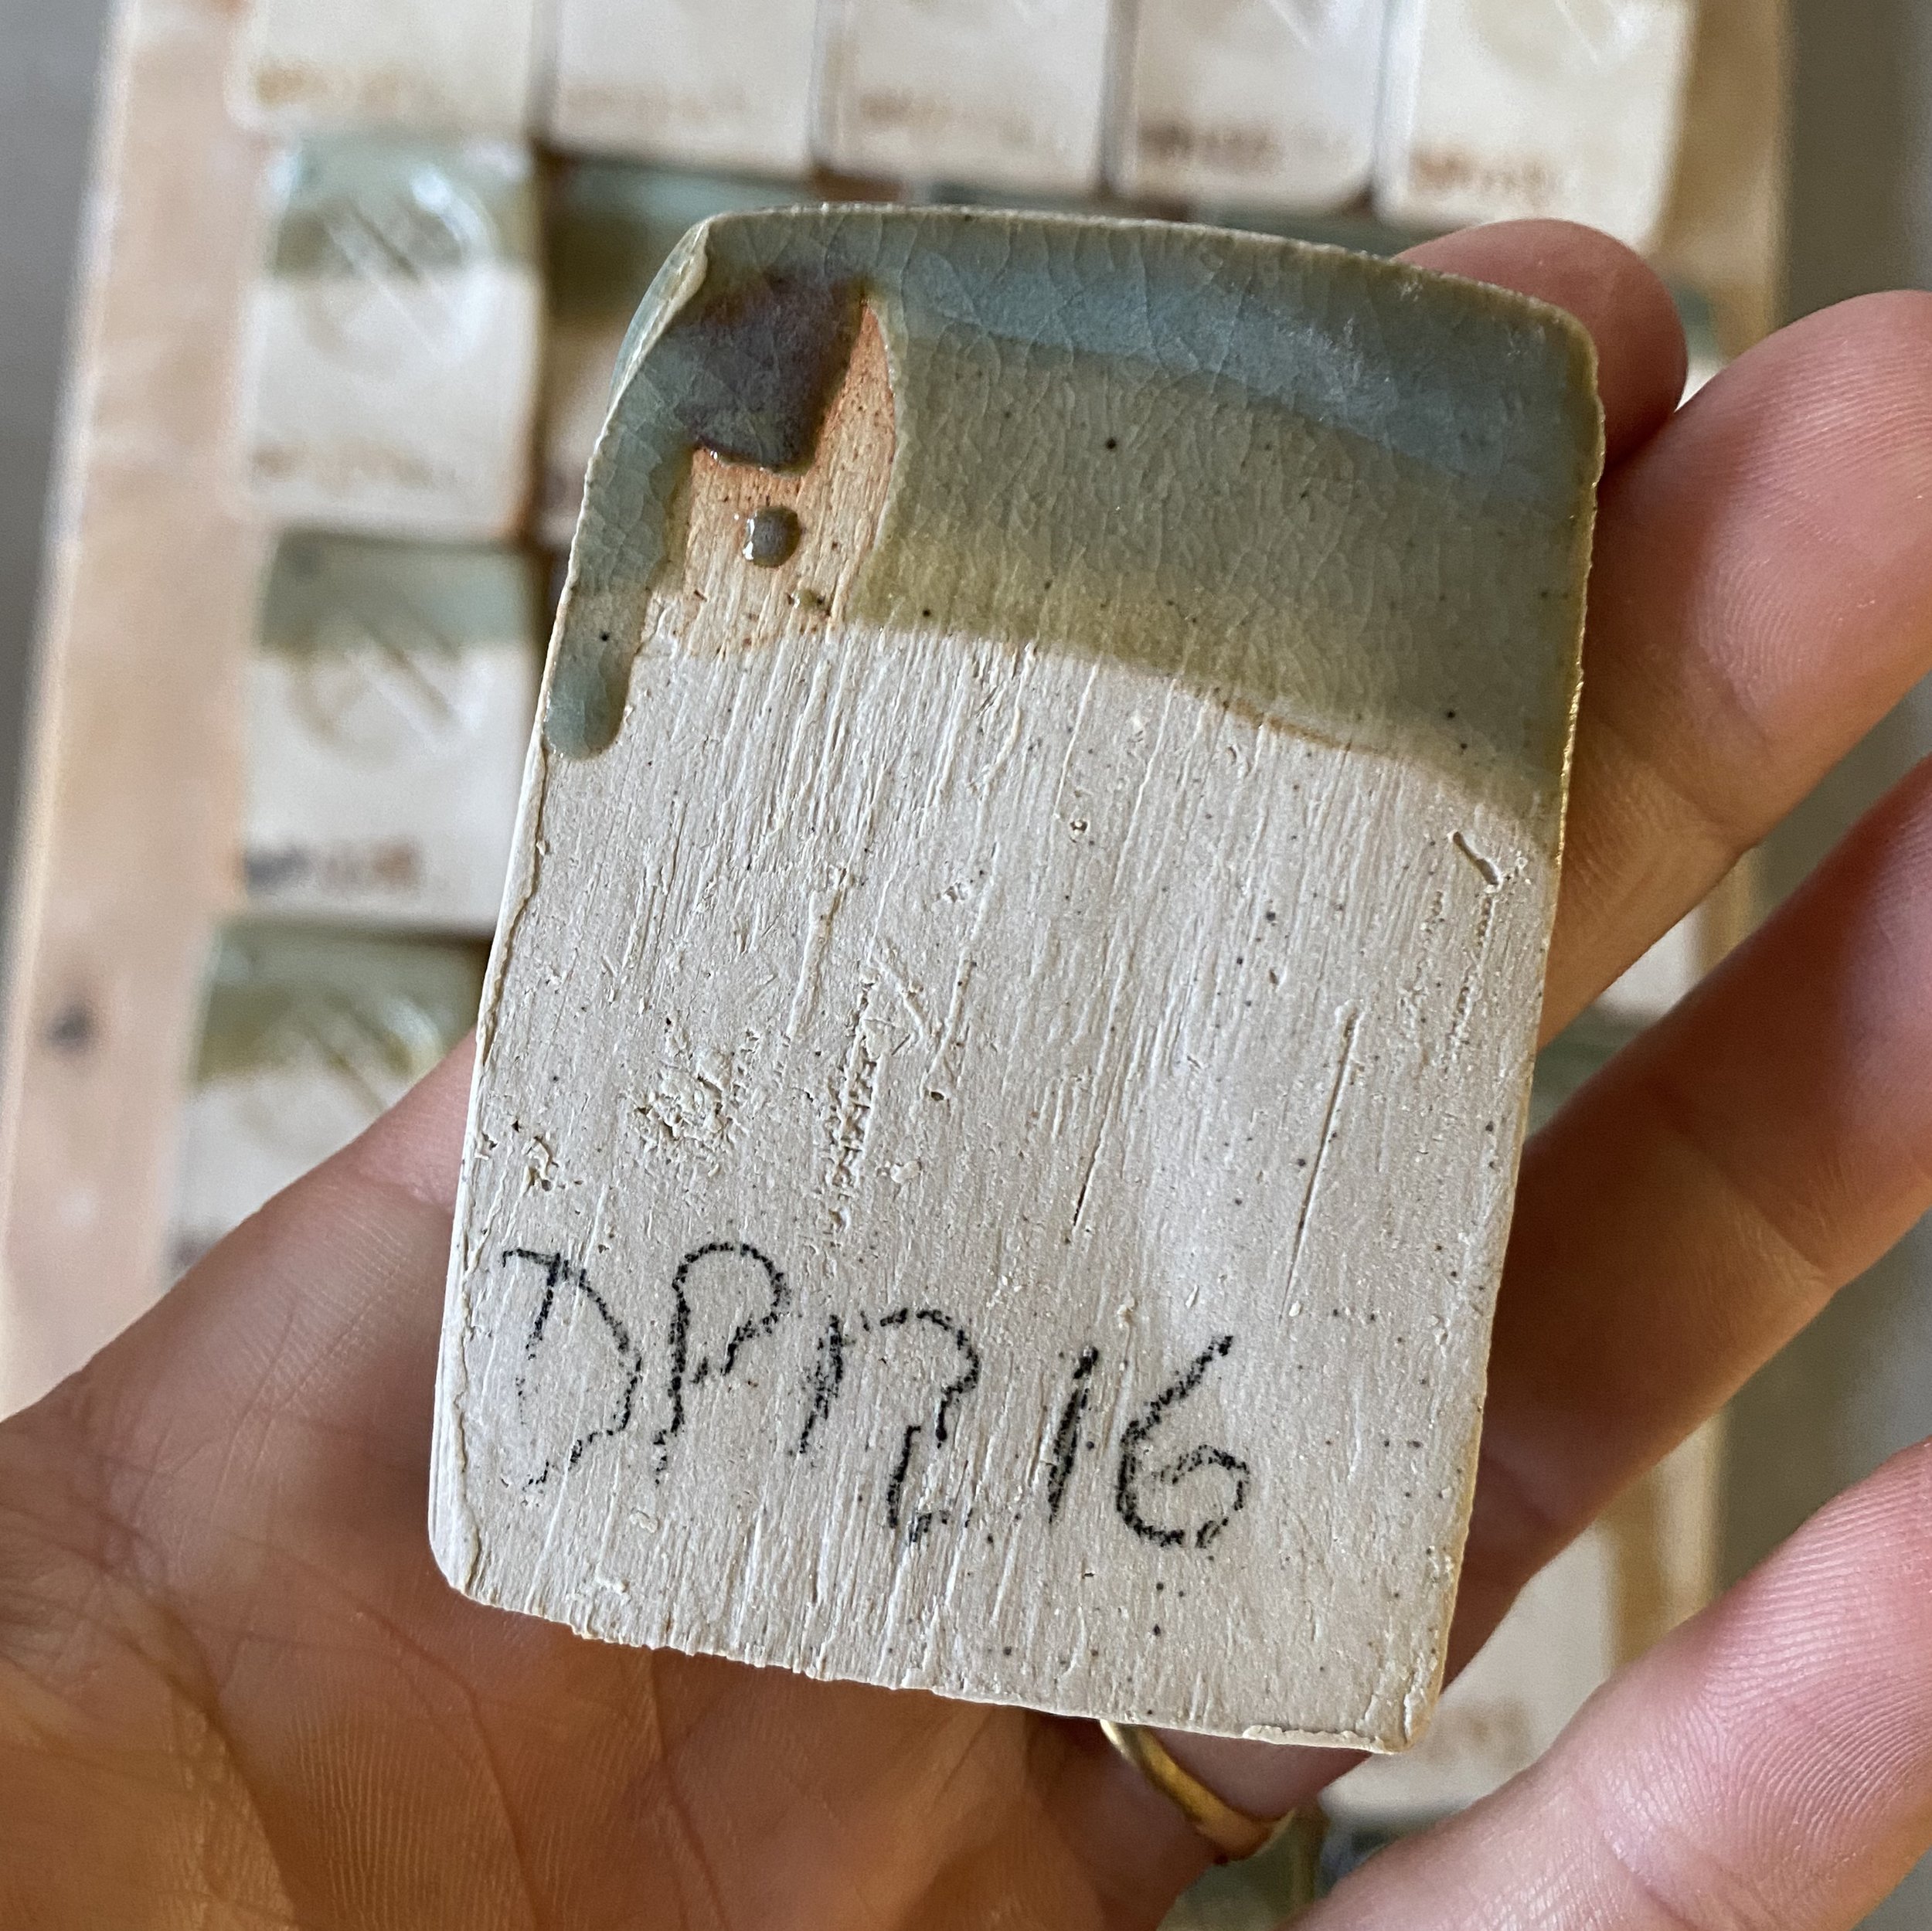
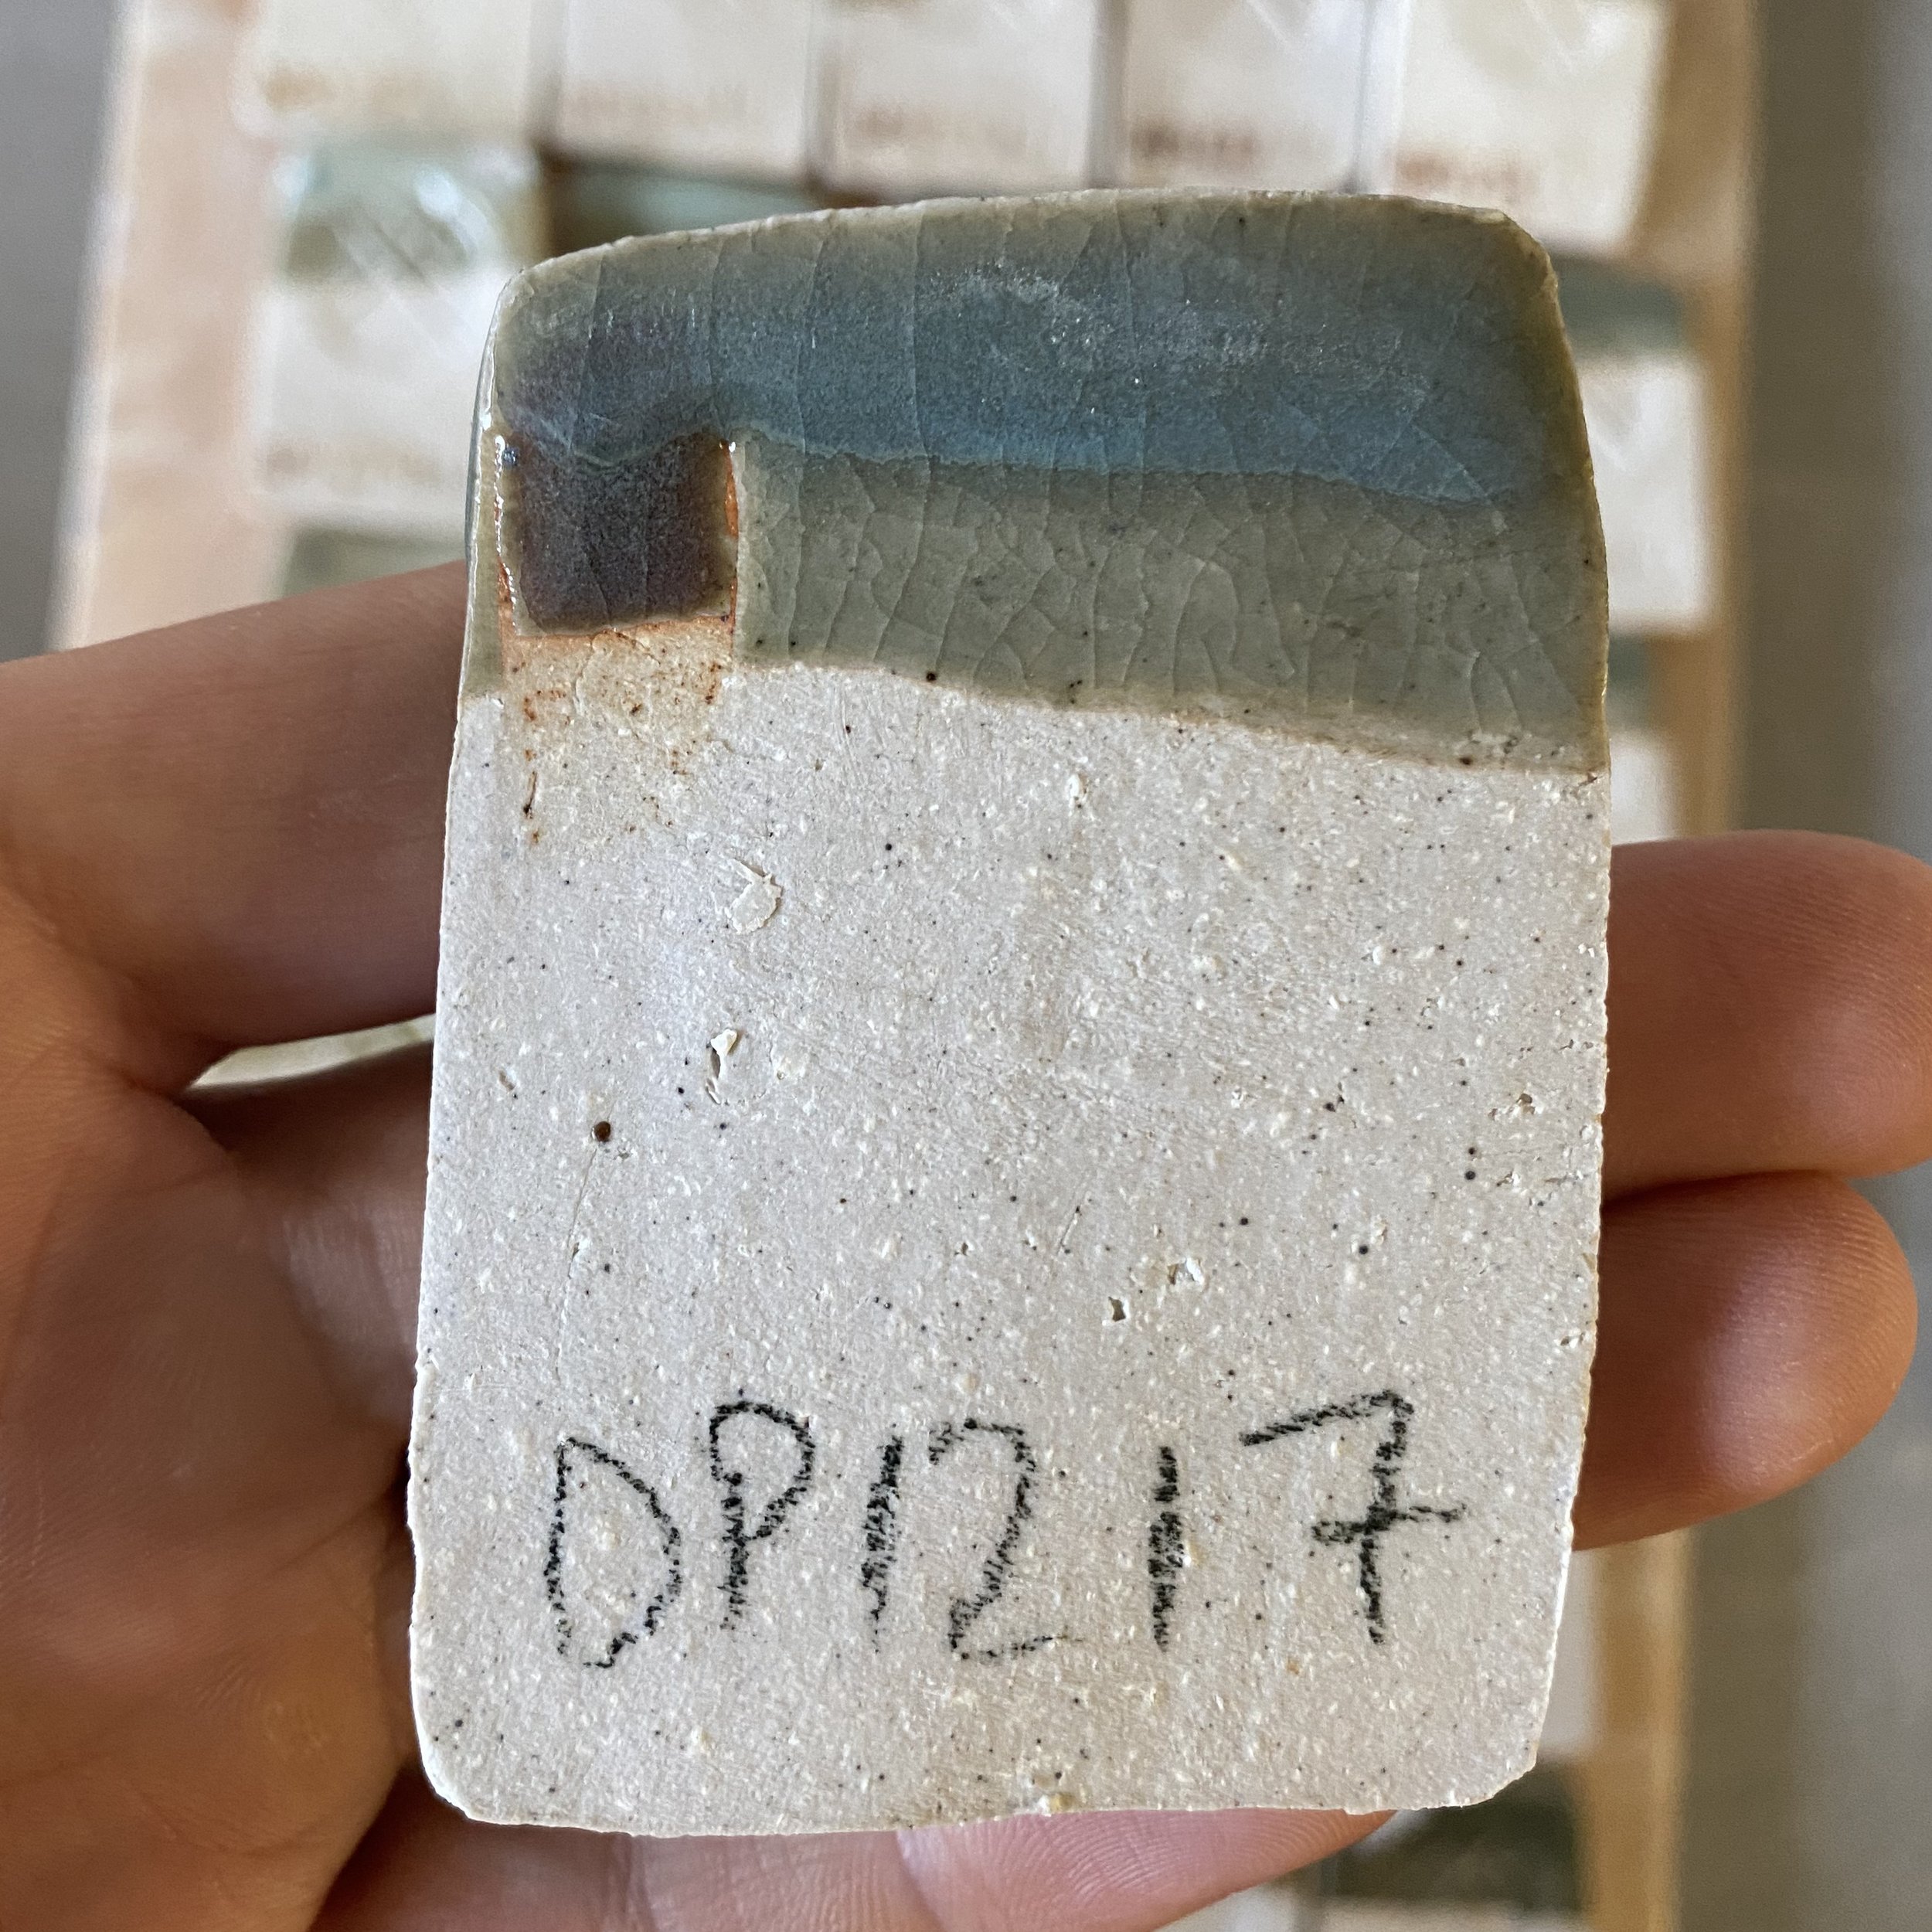
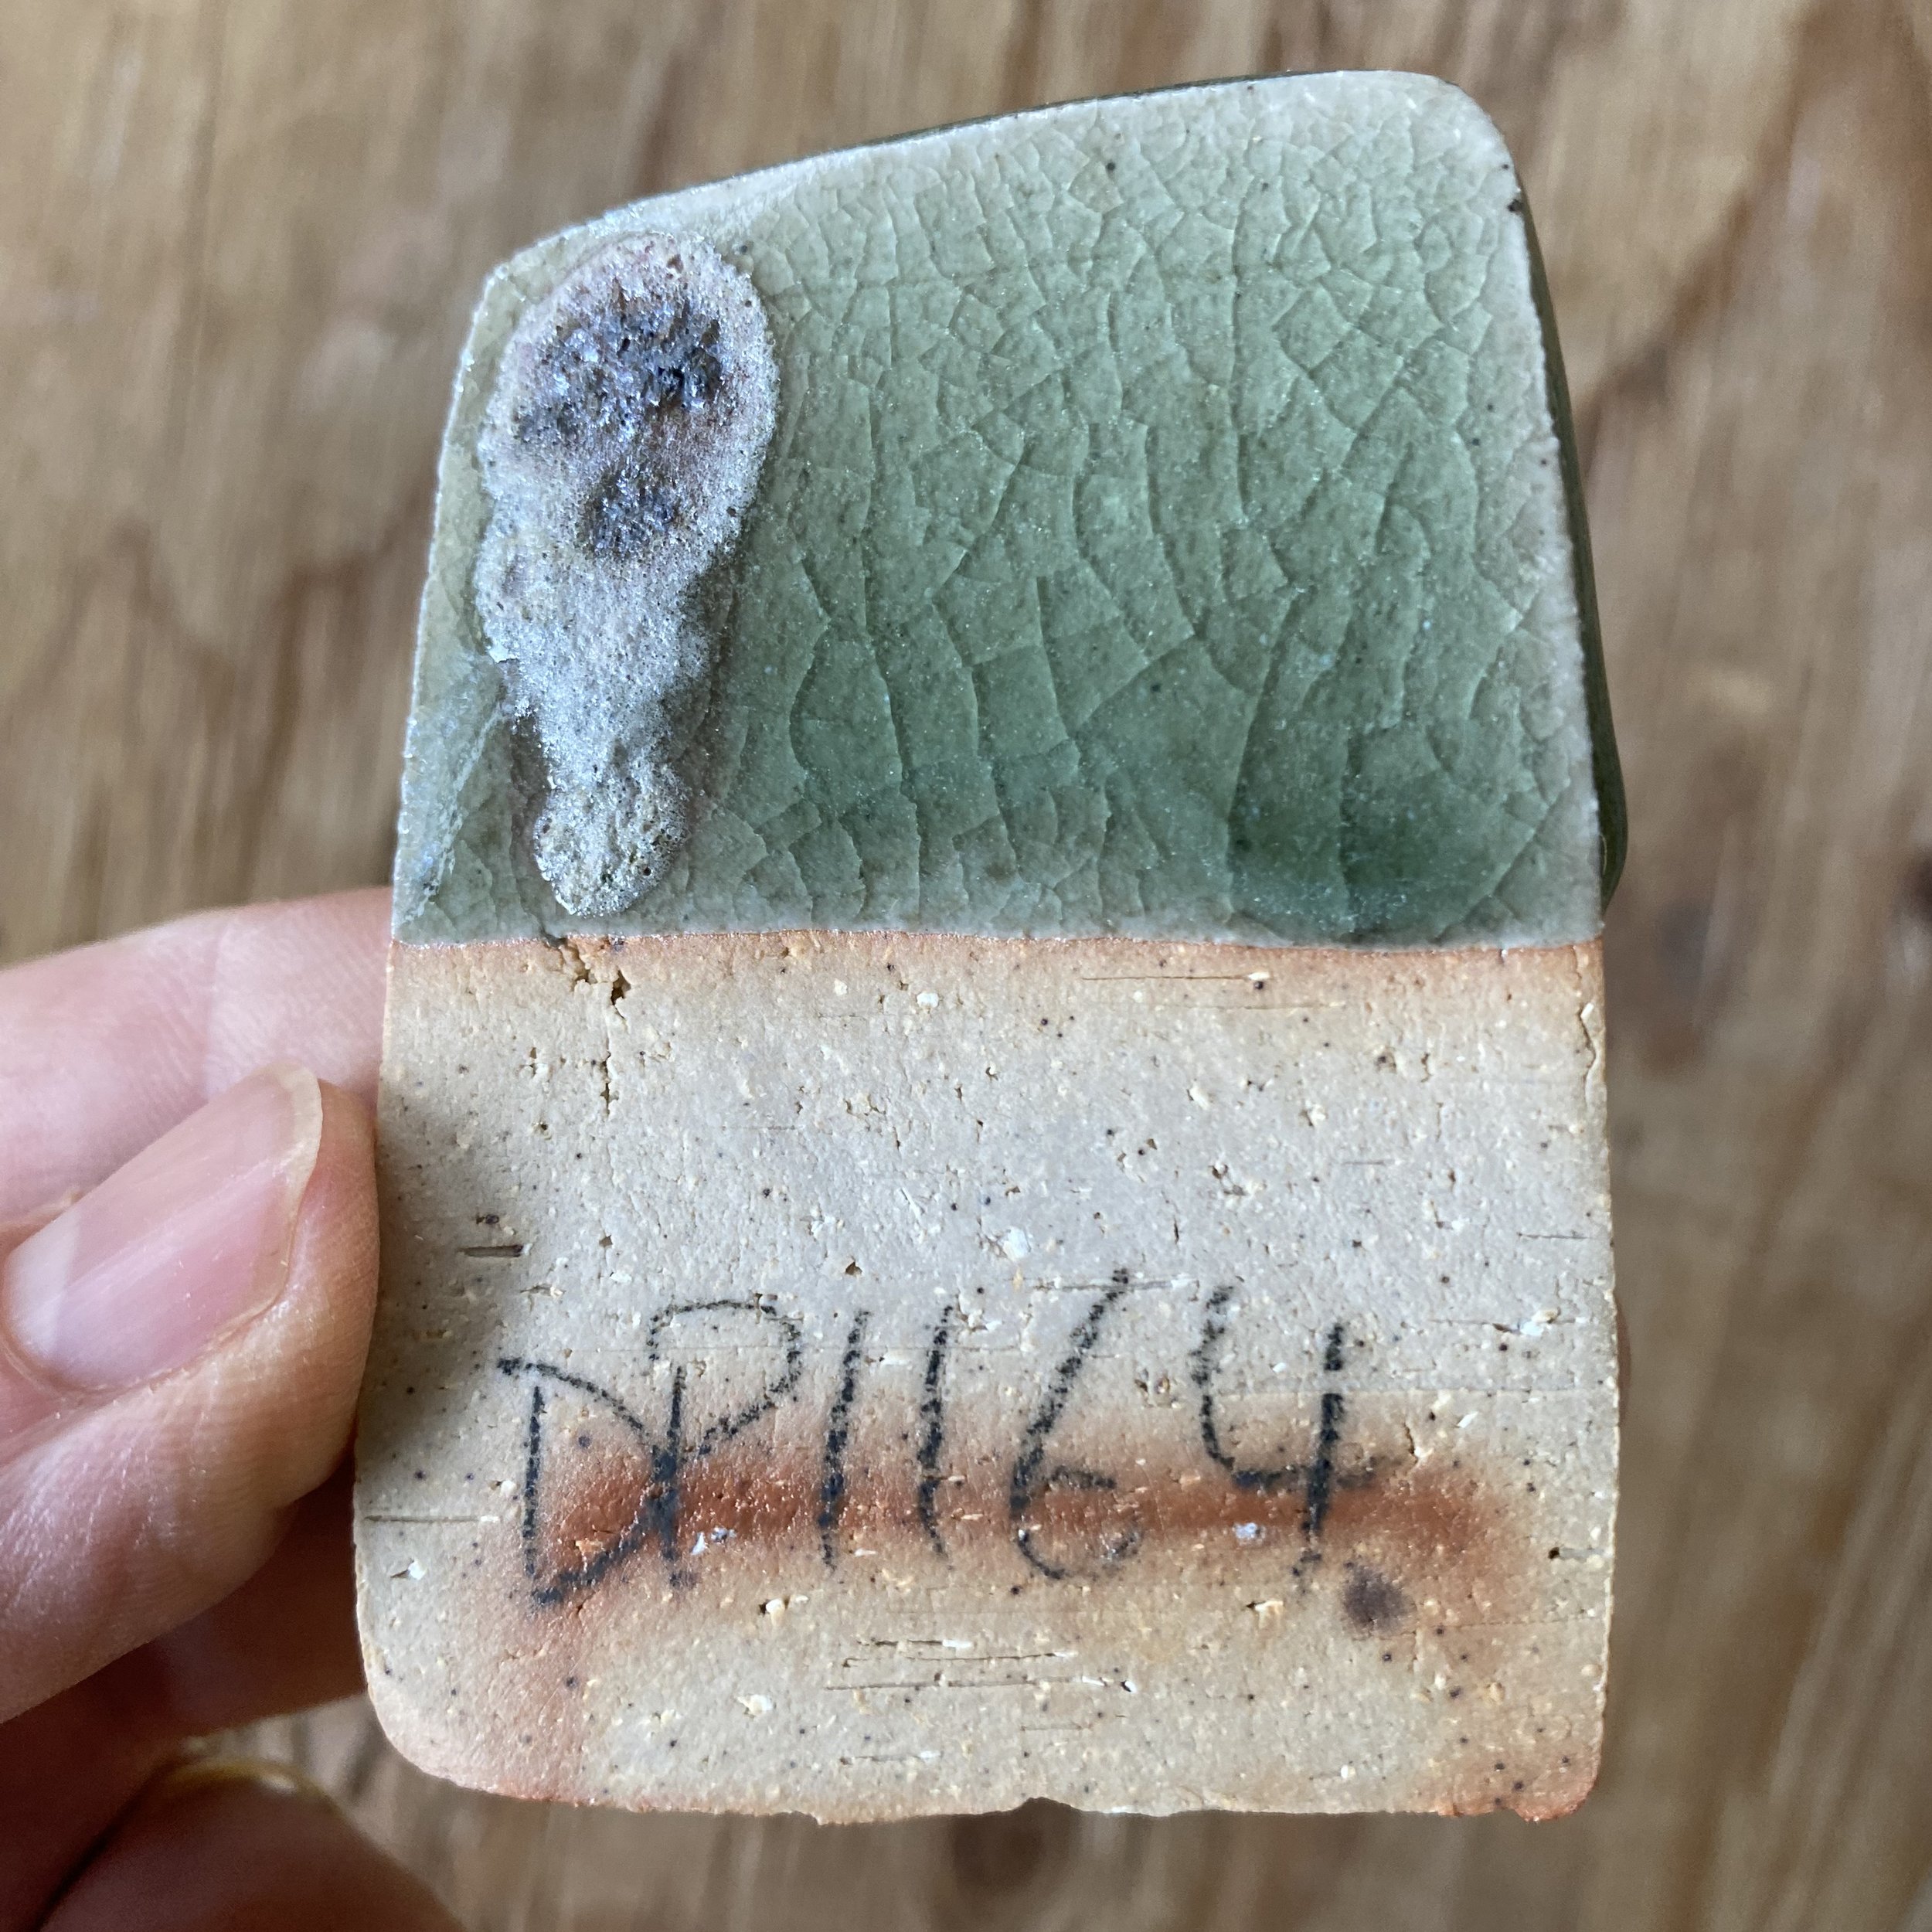
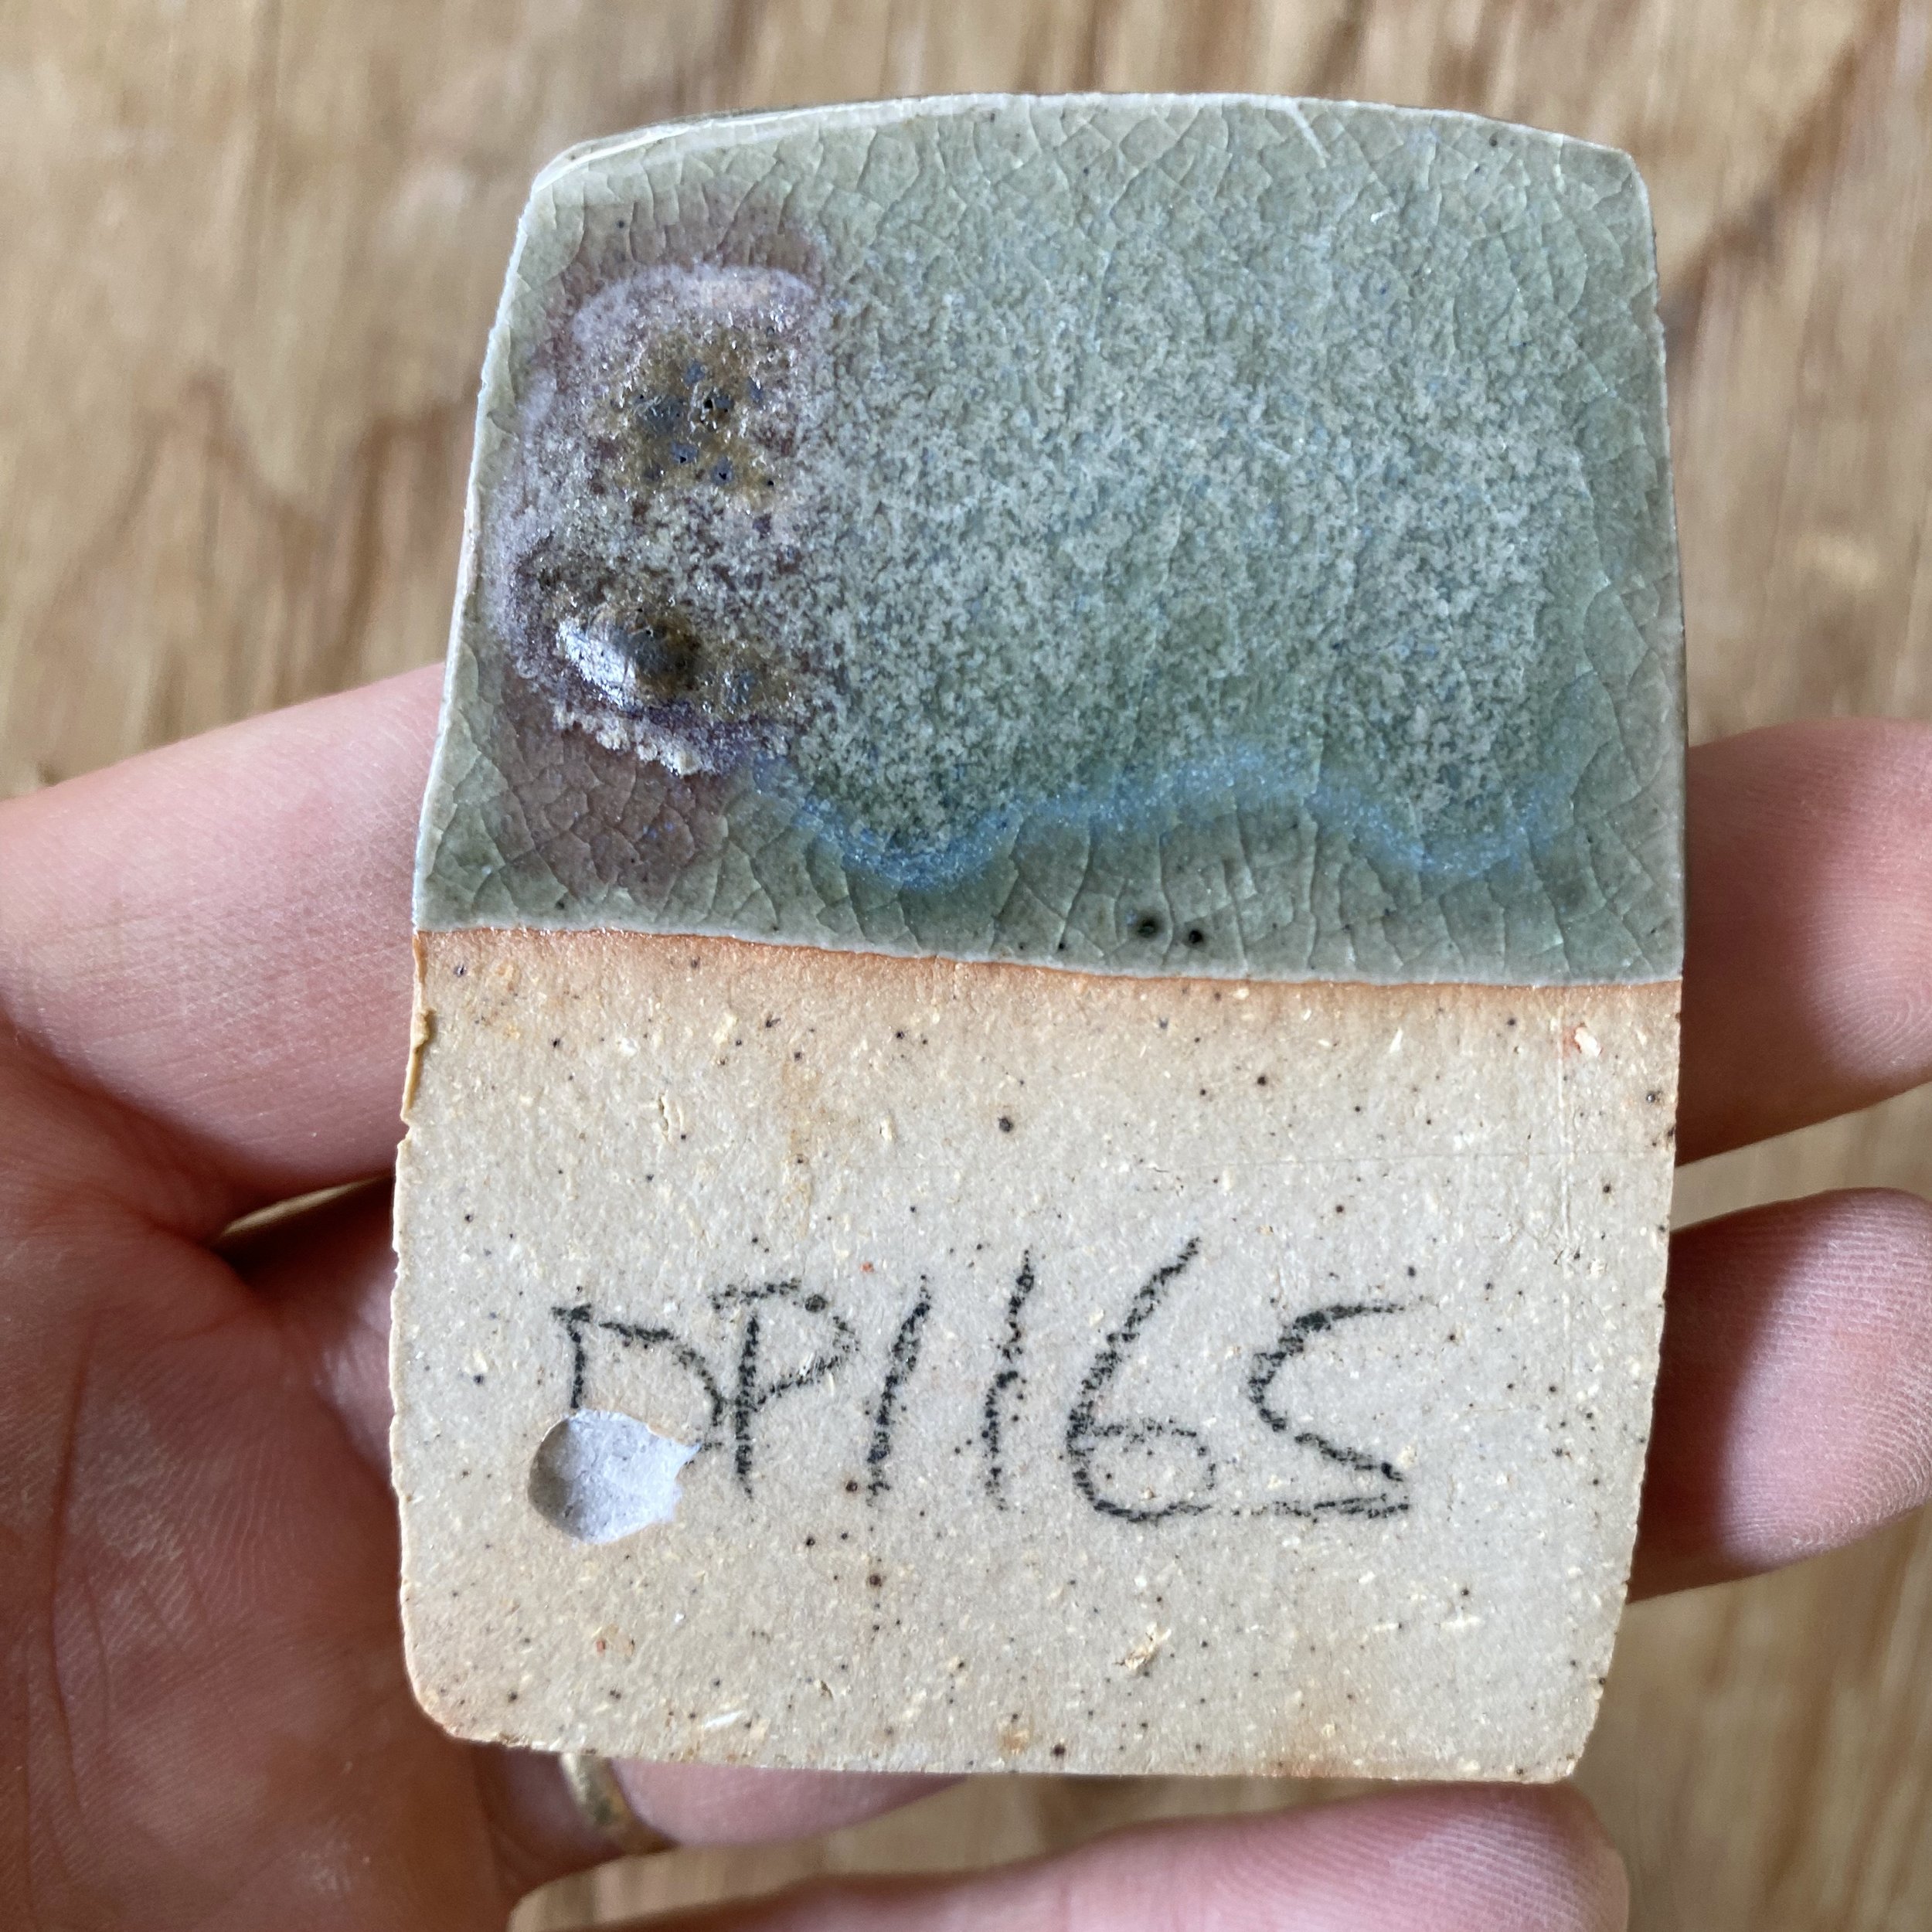
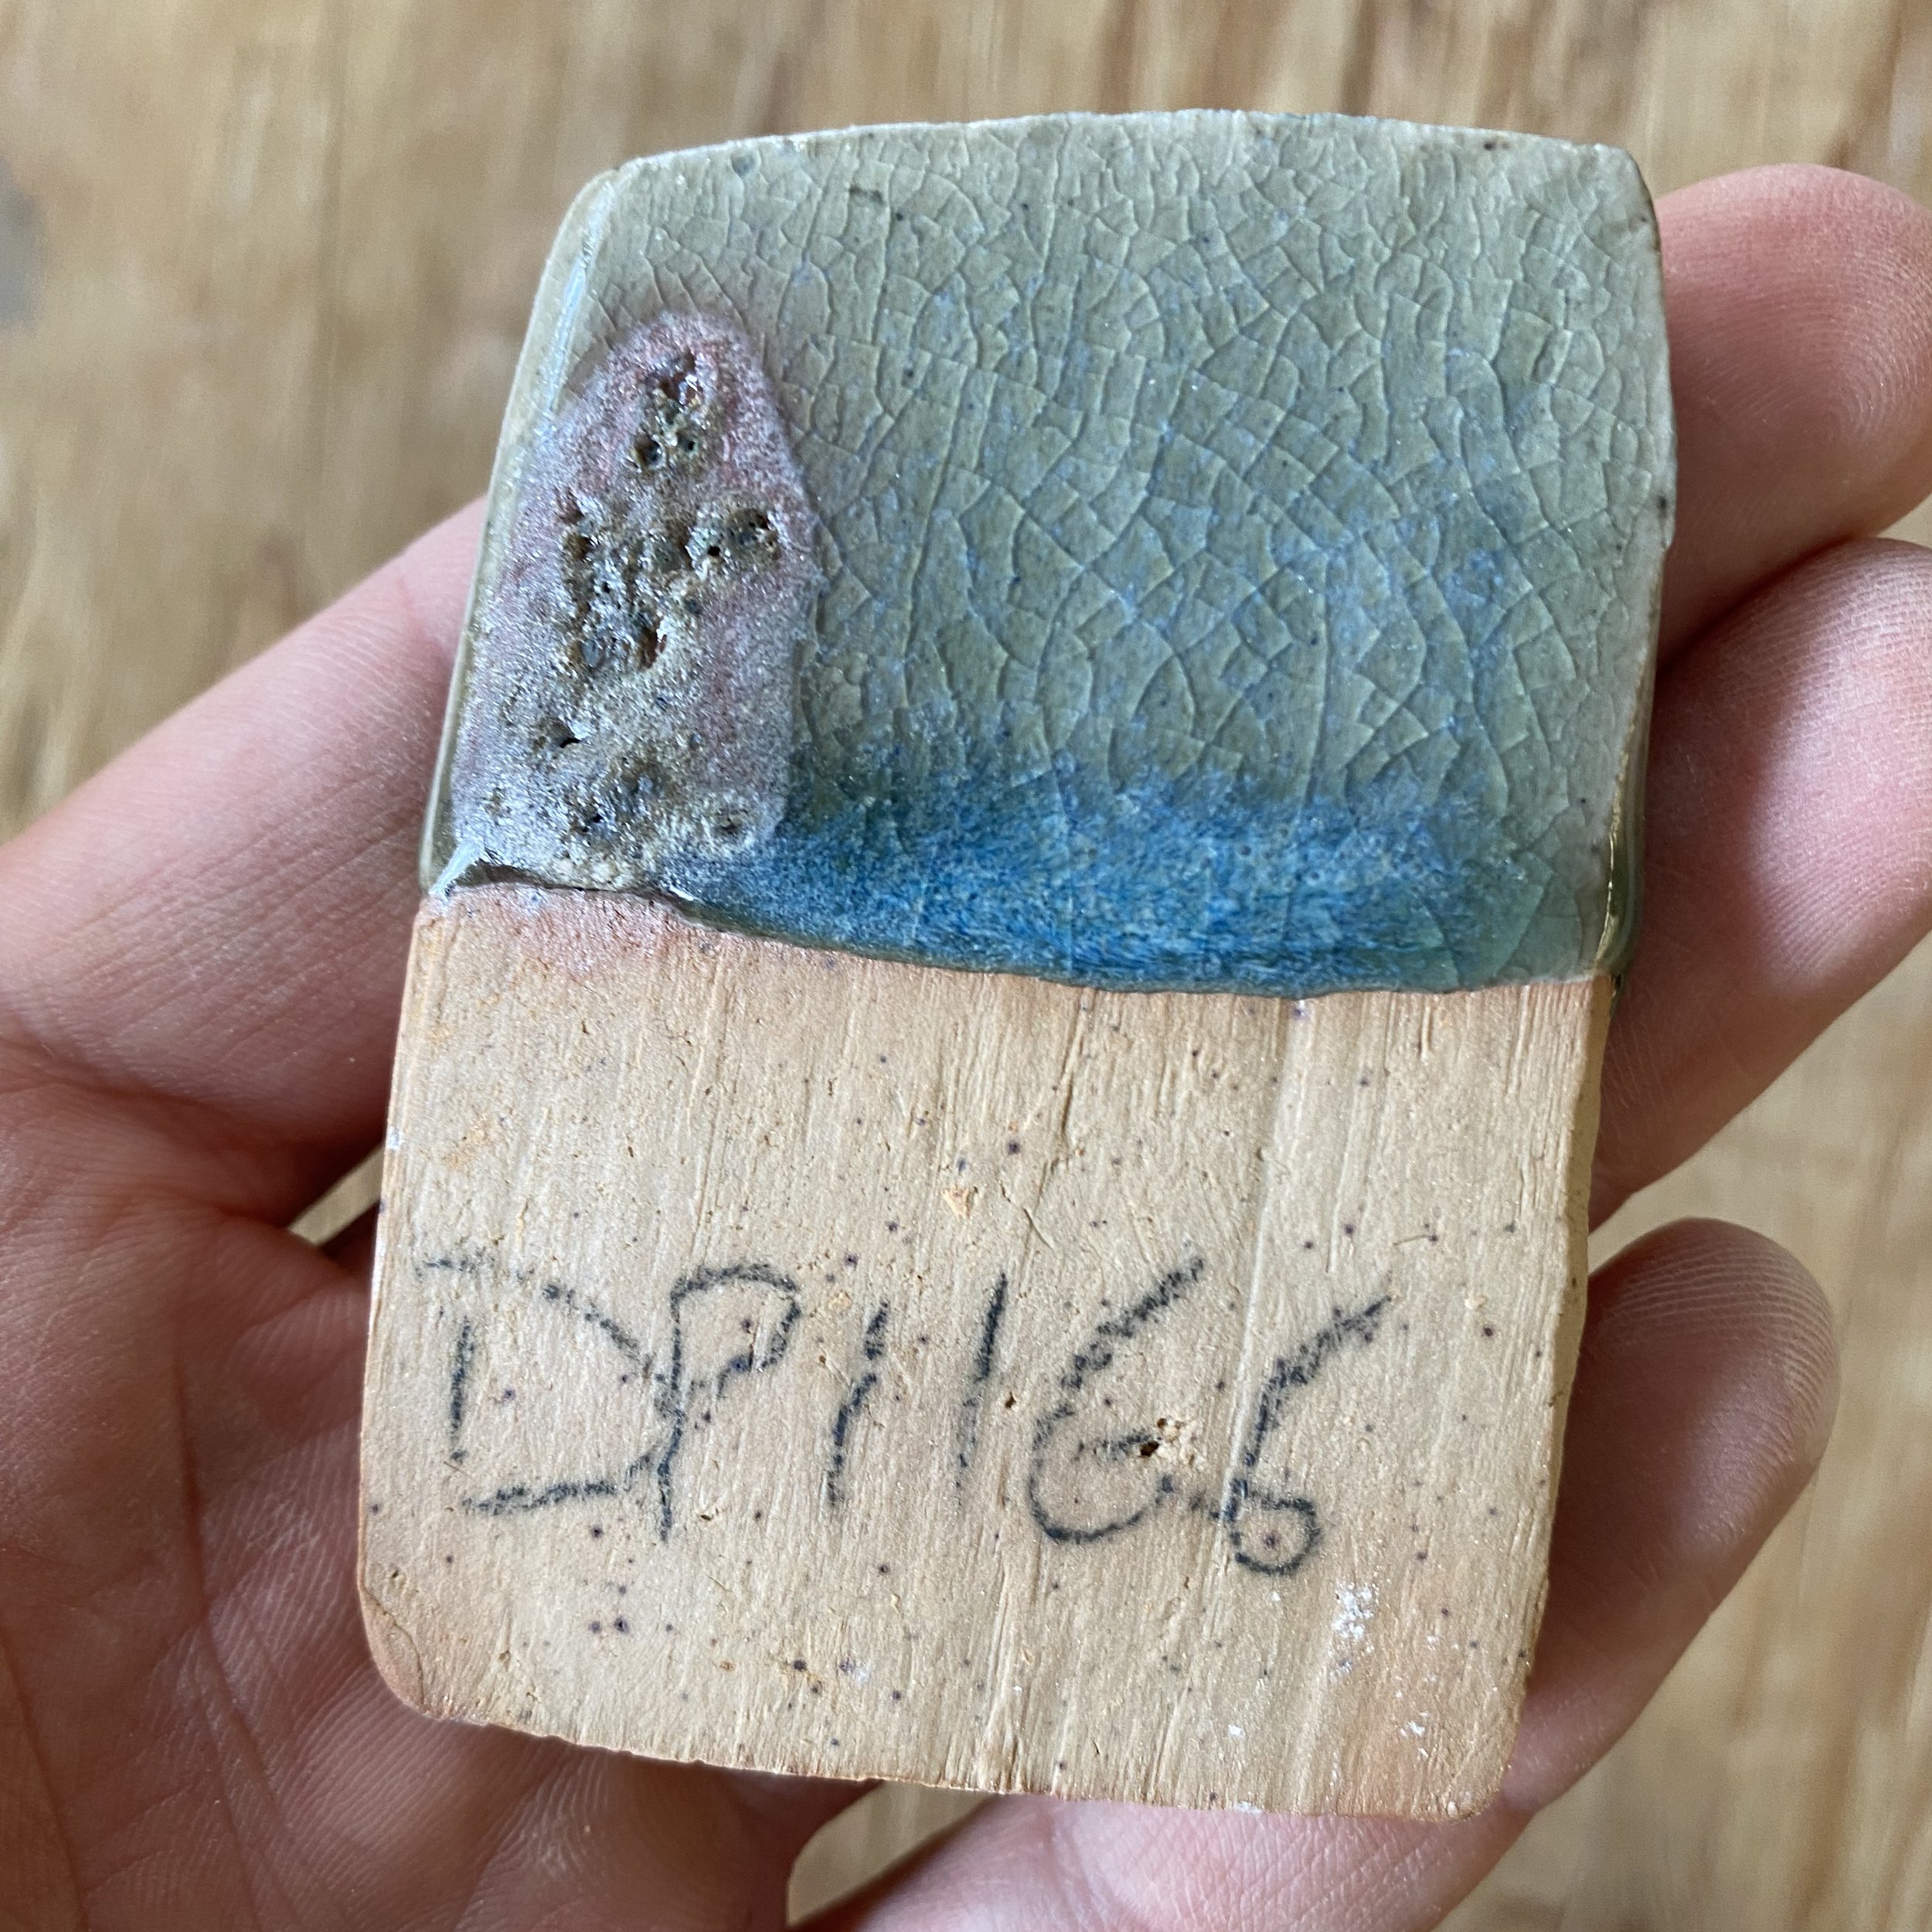
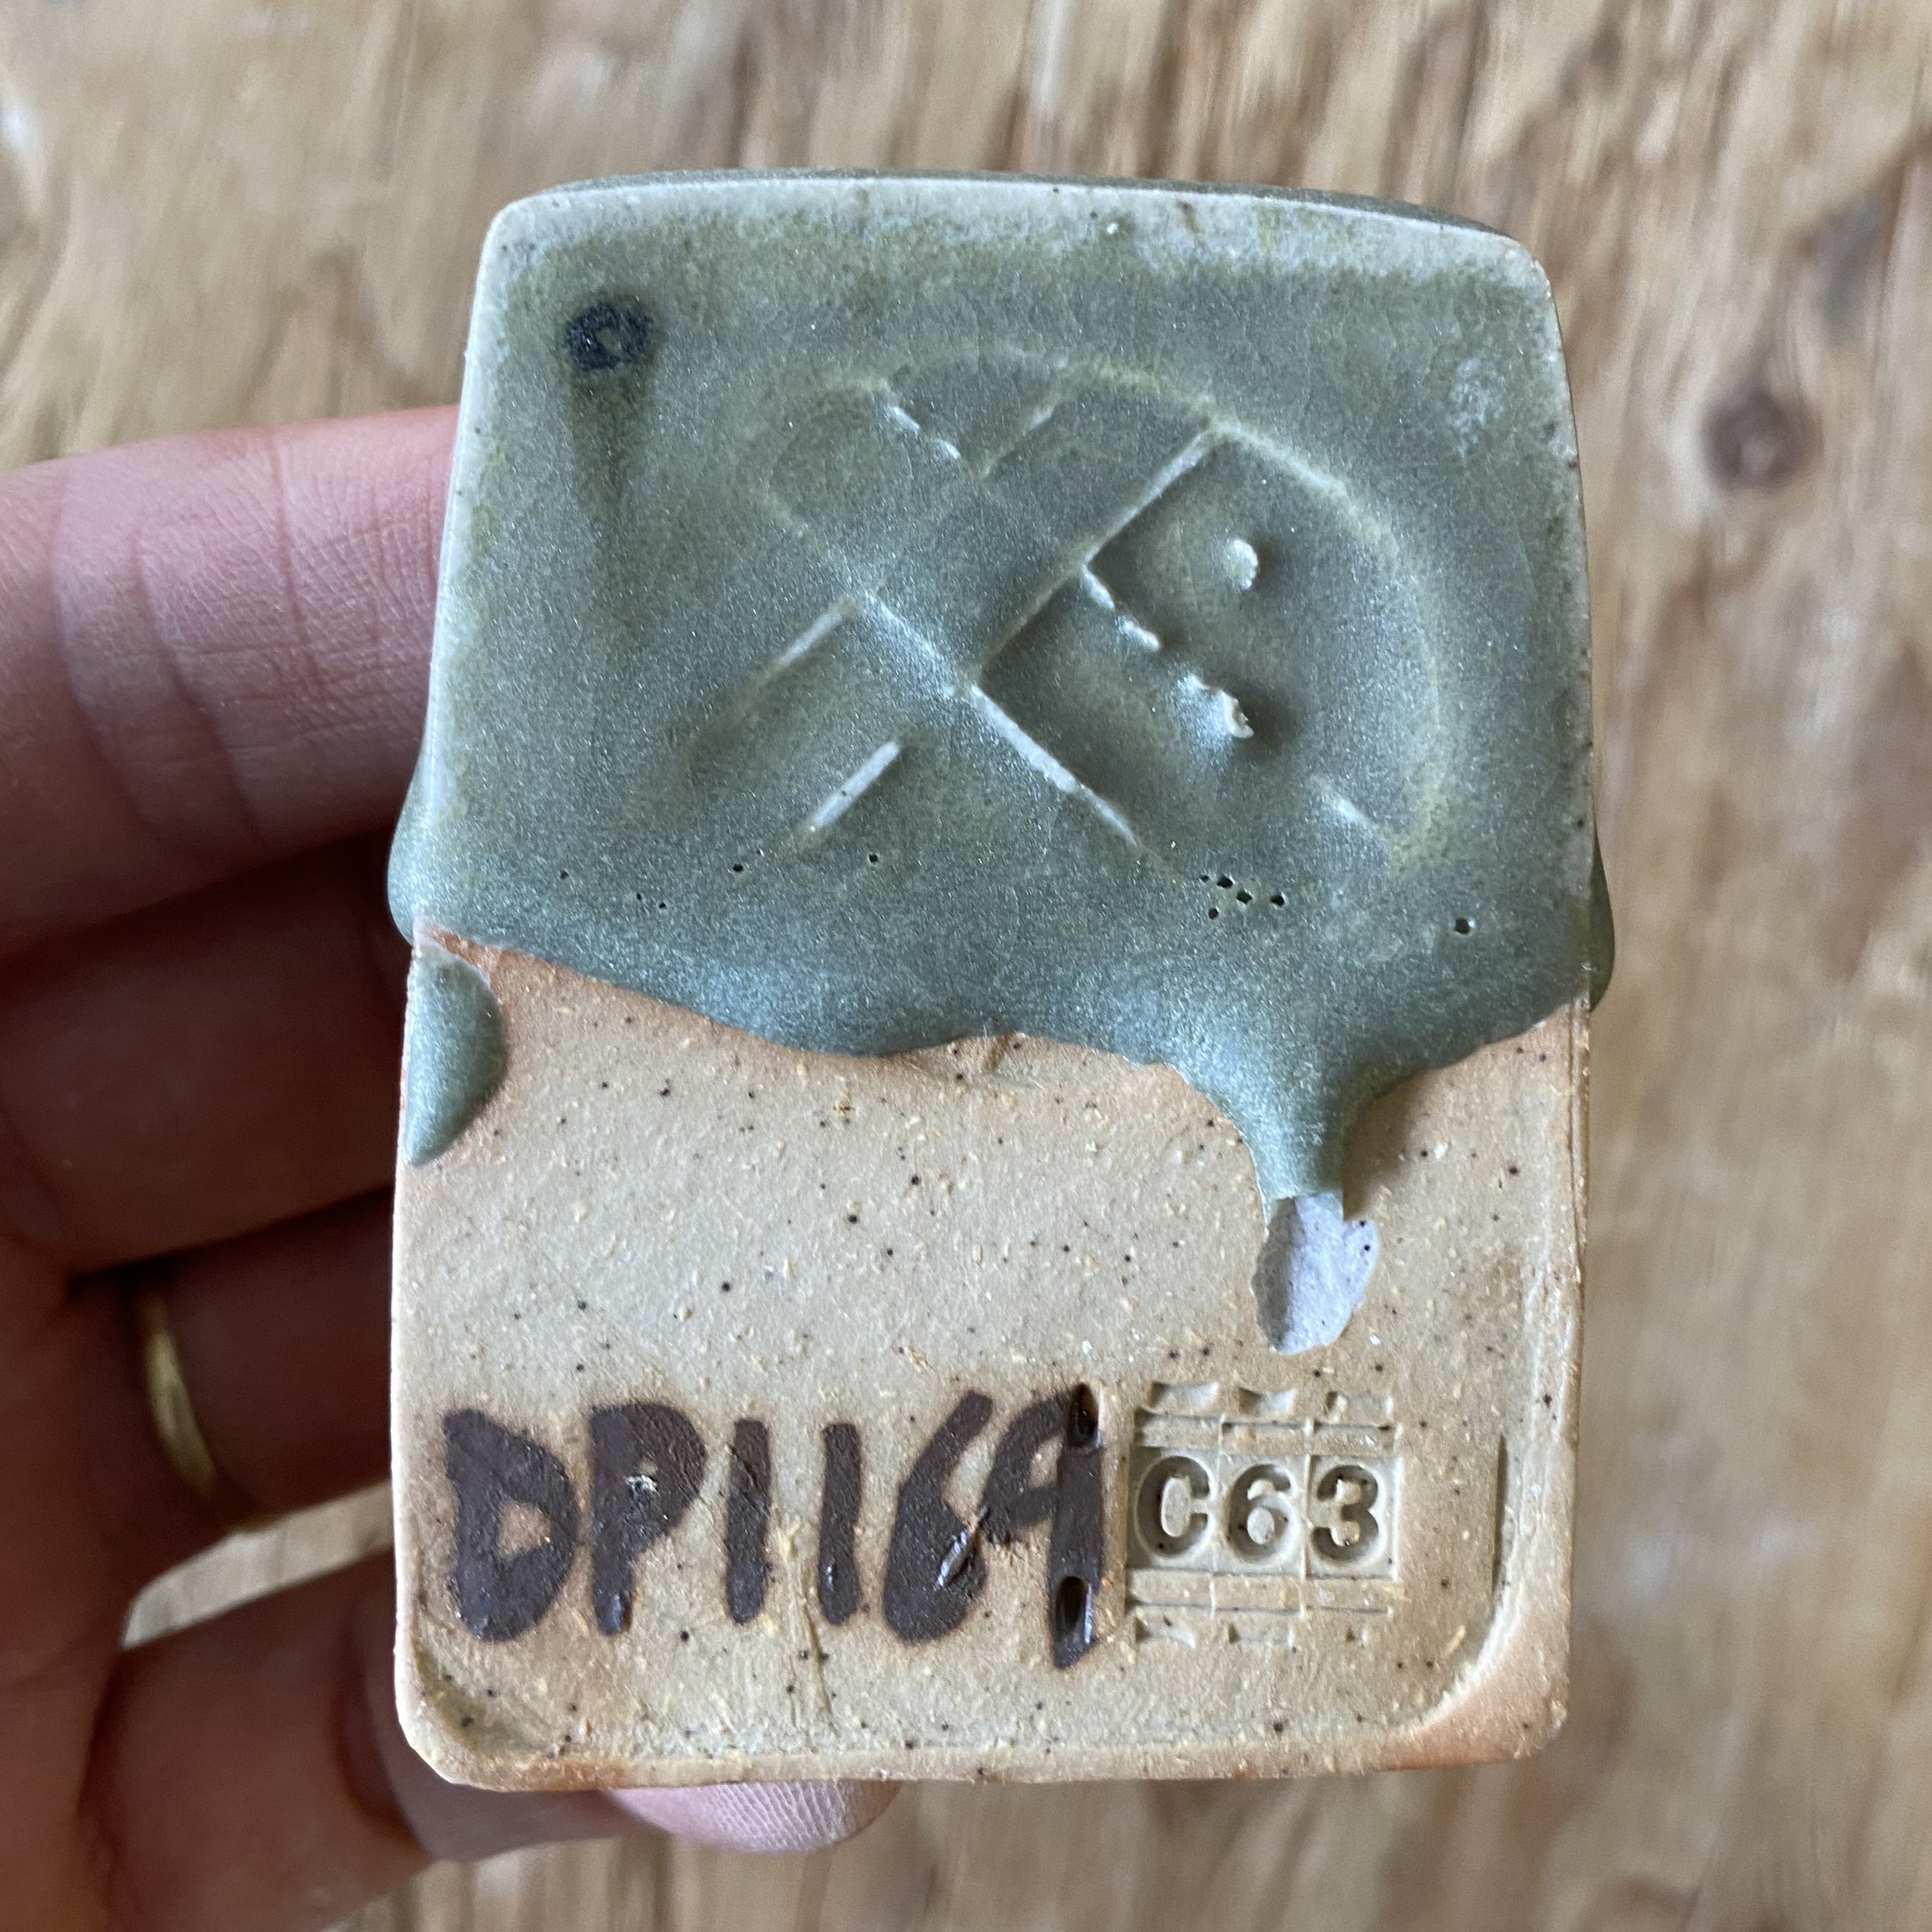
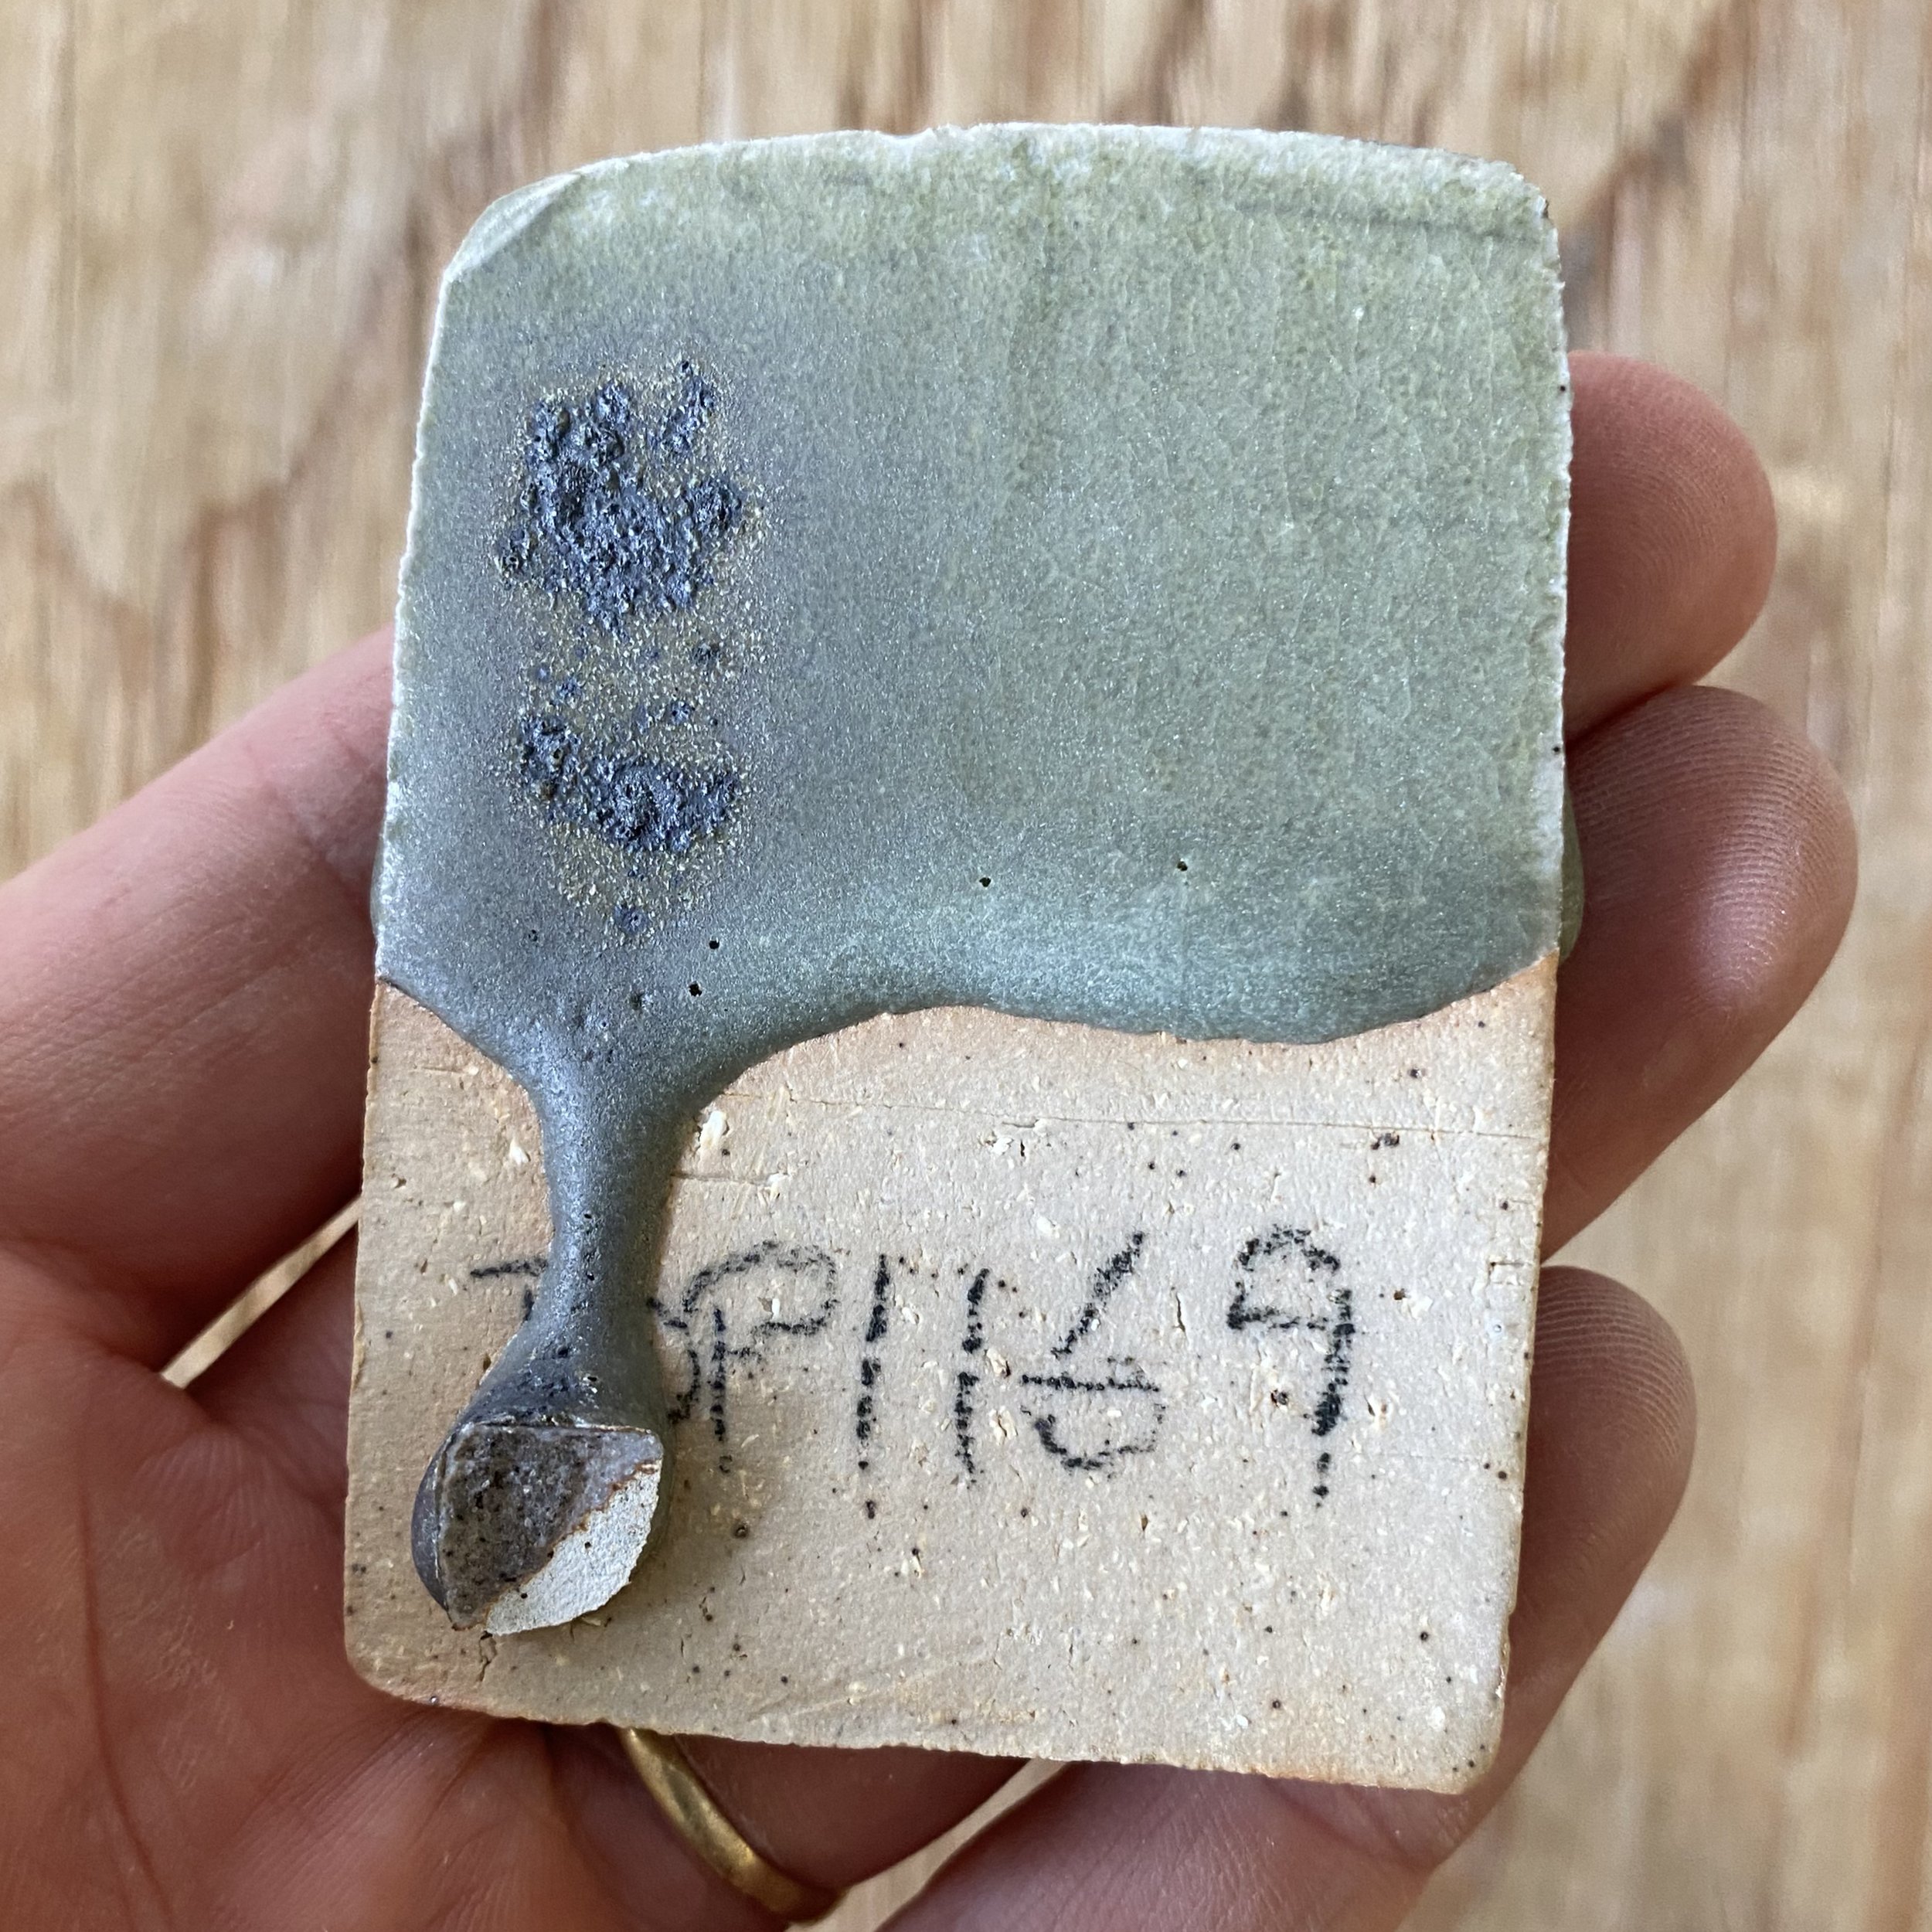
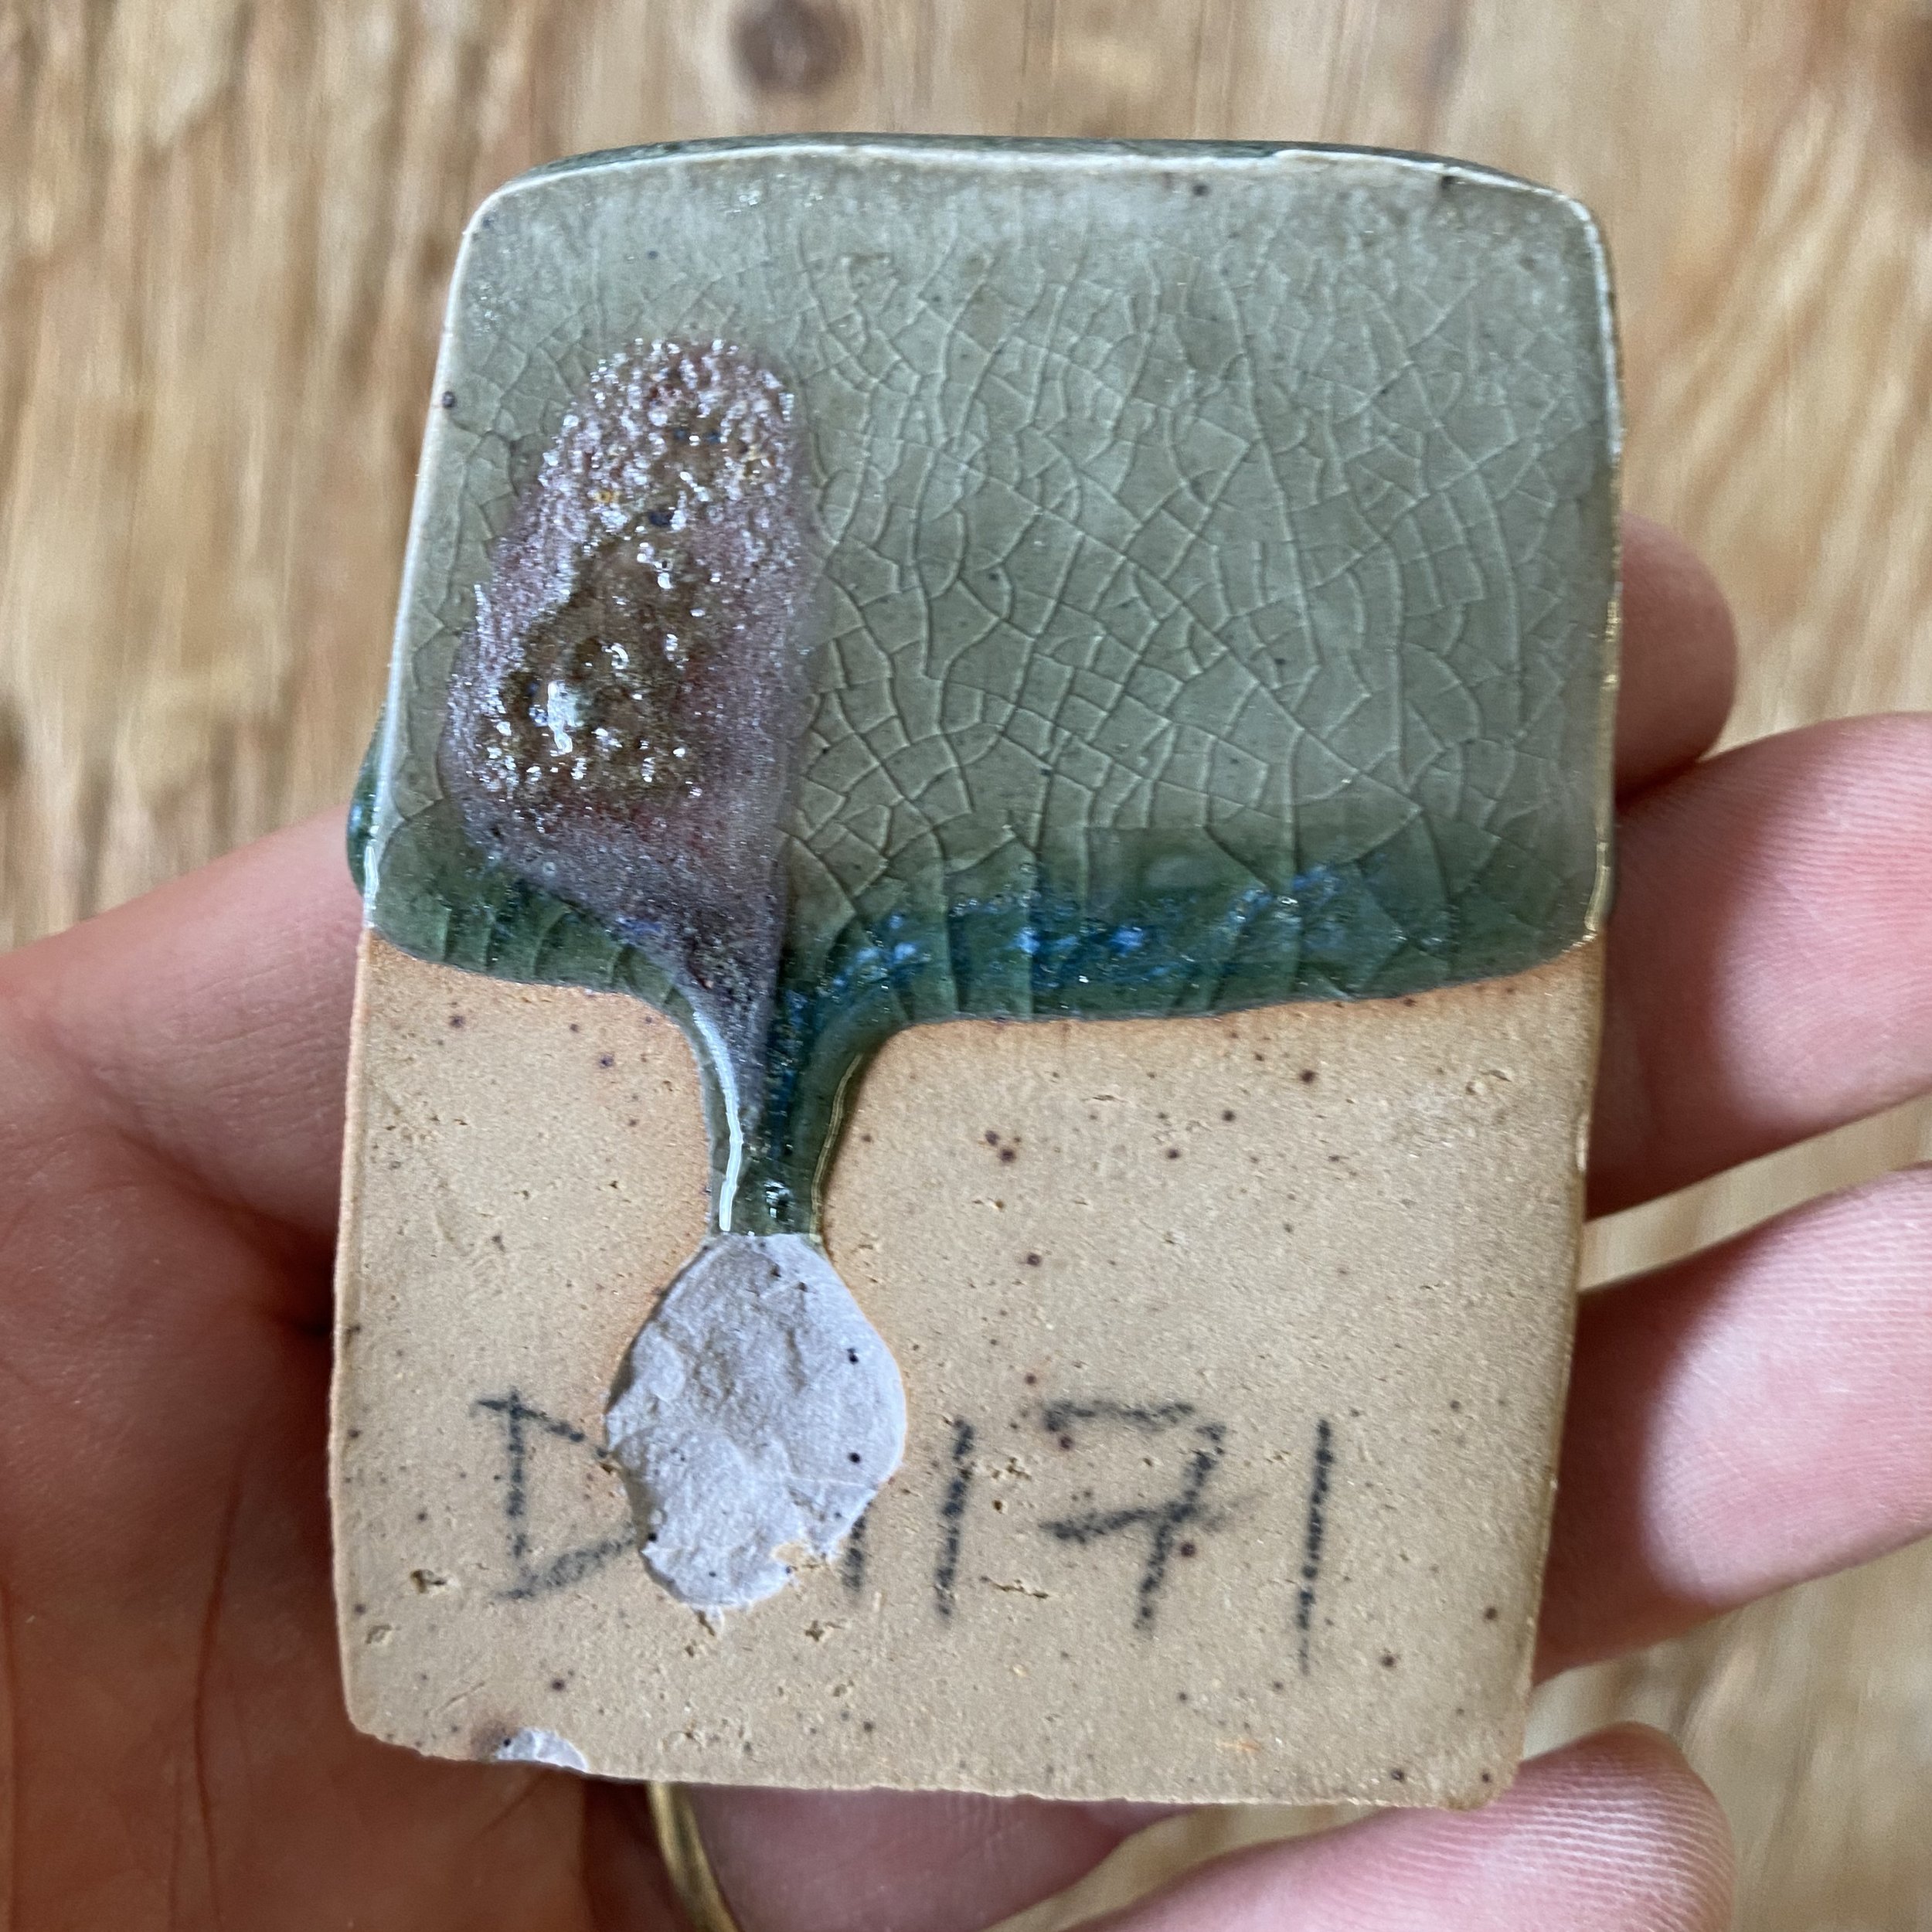
Back side of the tiles (with copper carbonate swatch on top left corner):
It looks to me like the glazes from DP1259 to DP1267, as well as DP1272, look the best. Let’s look at their composition…
DP1272 reads: 56.25 DP, 19.16 Wollastonite, 20.83 Silica, 3.75 Mahavir Feldspar, plus the 7% additions.
What can we conclude from this appearing to be the best zone? In all of them, the silica level is higher than the wollastonite, but they are pretty similar really. Let’s compare a few tiles: DP1259 which has 3.33% less wollastonite compared to silica, DP1264 which has equal amounts silica to wollastonite, and then DP1269 which has 3.33% more wollastonite compared to silica. In these three tiles, we have a nice little line blend. It seems clear to me that with the extra silica, the opalescent effect is stronger. DP1259 is the cloudiest, compared to DP1269 which is the most transluscent still. However, you can see the opalescent Jun effect on all of the tiles and I think if they were in a more reduced part of the kiln, DP1264 AND DP1269 would have come out more like DP1259.
This is not the most reliable test, as the placement in the kiln and atmosphere clearly played a big role.
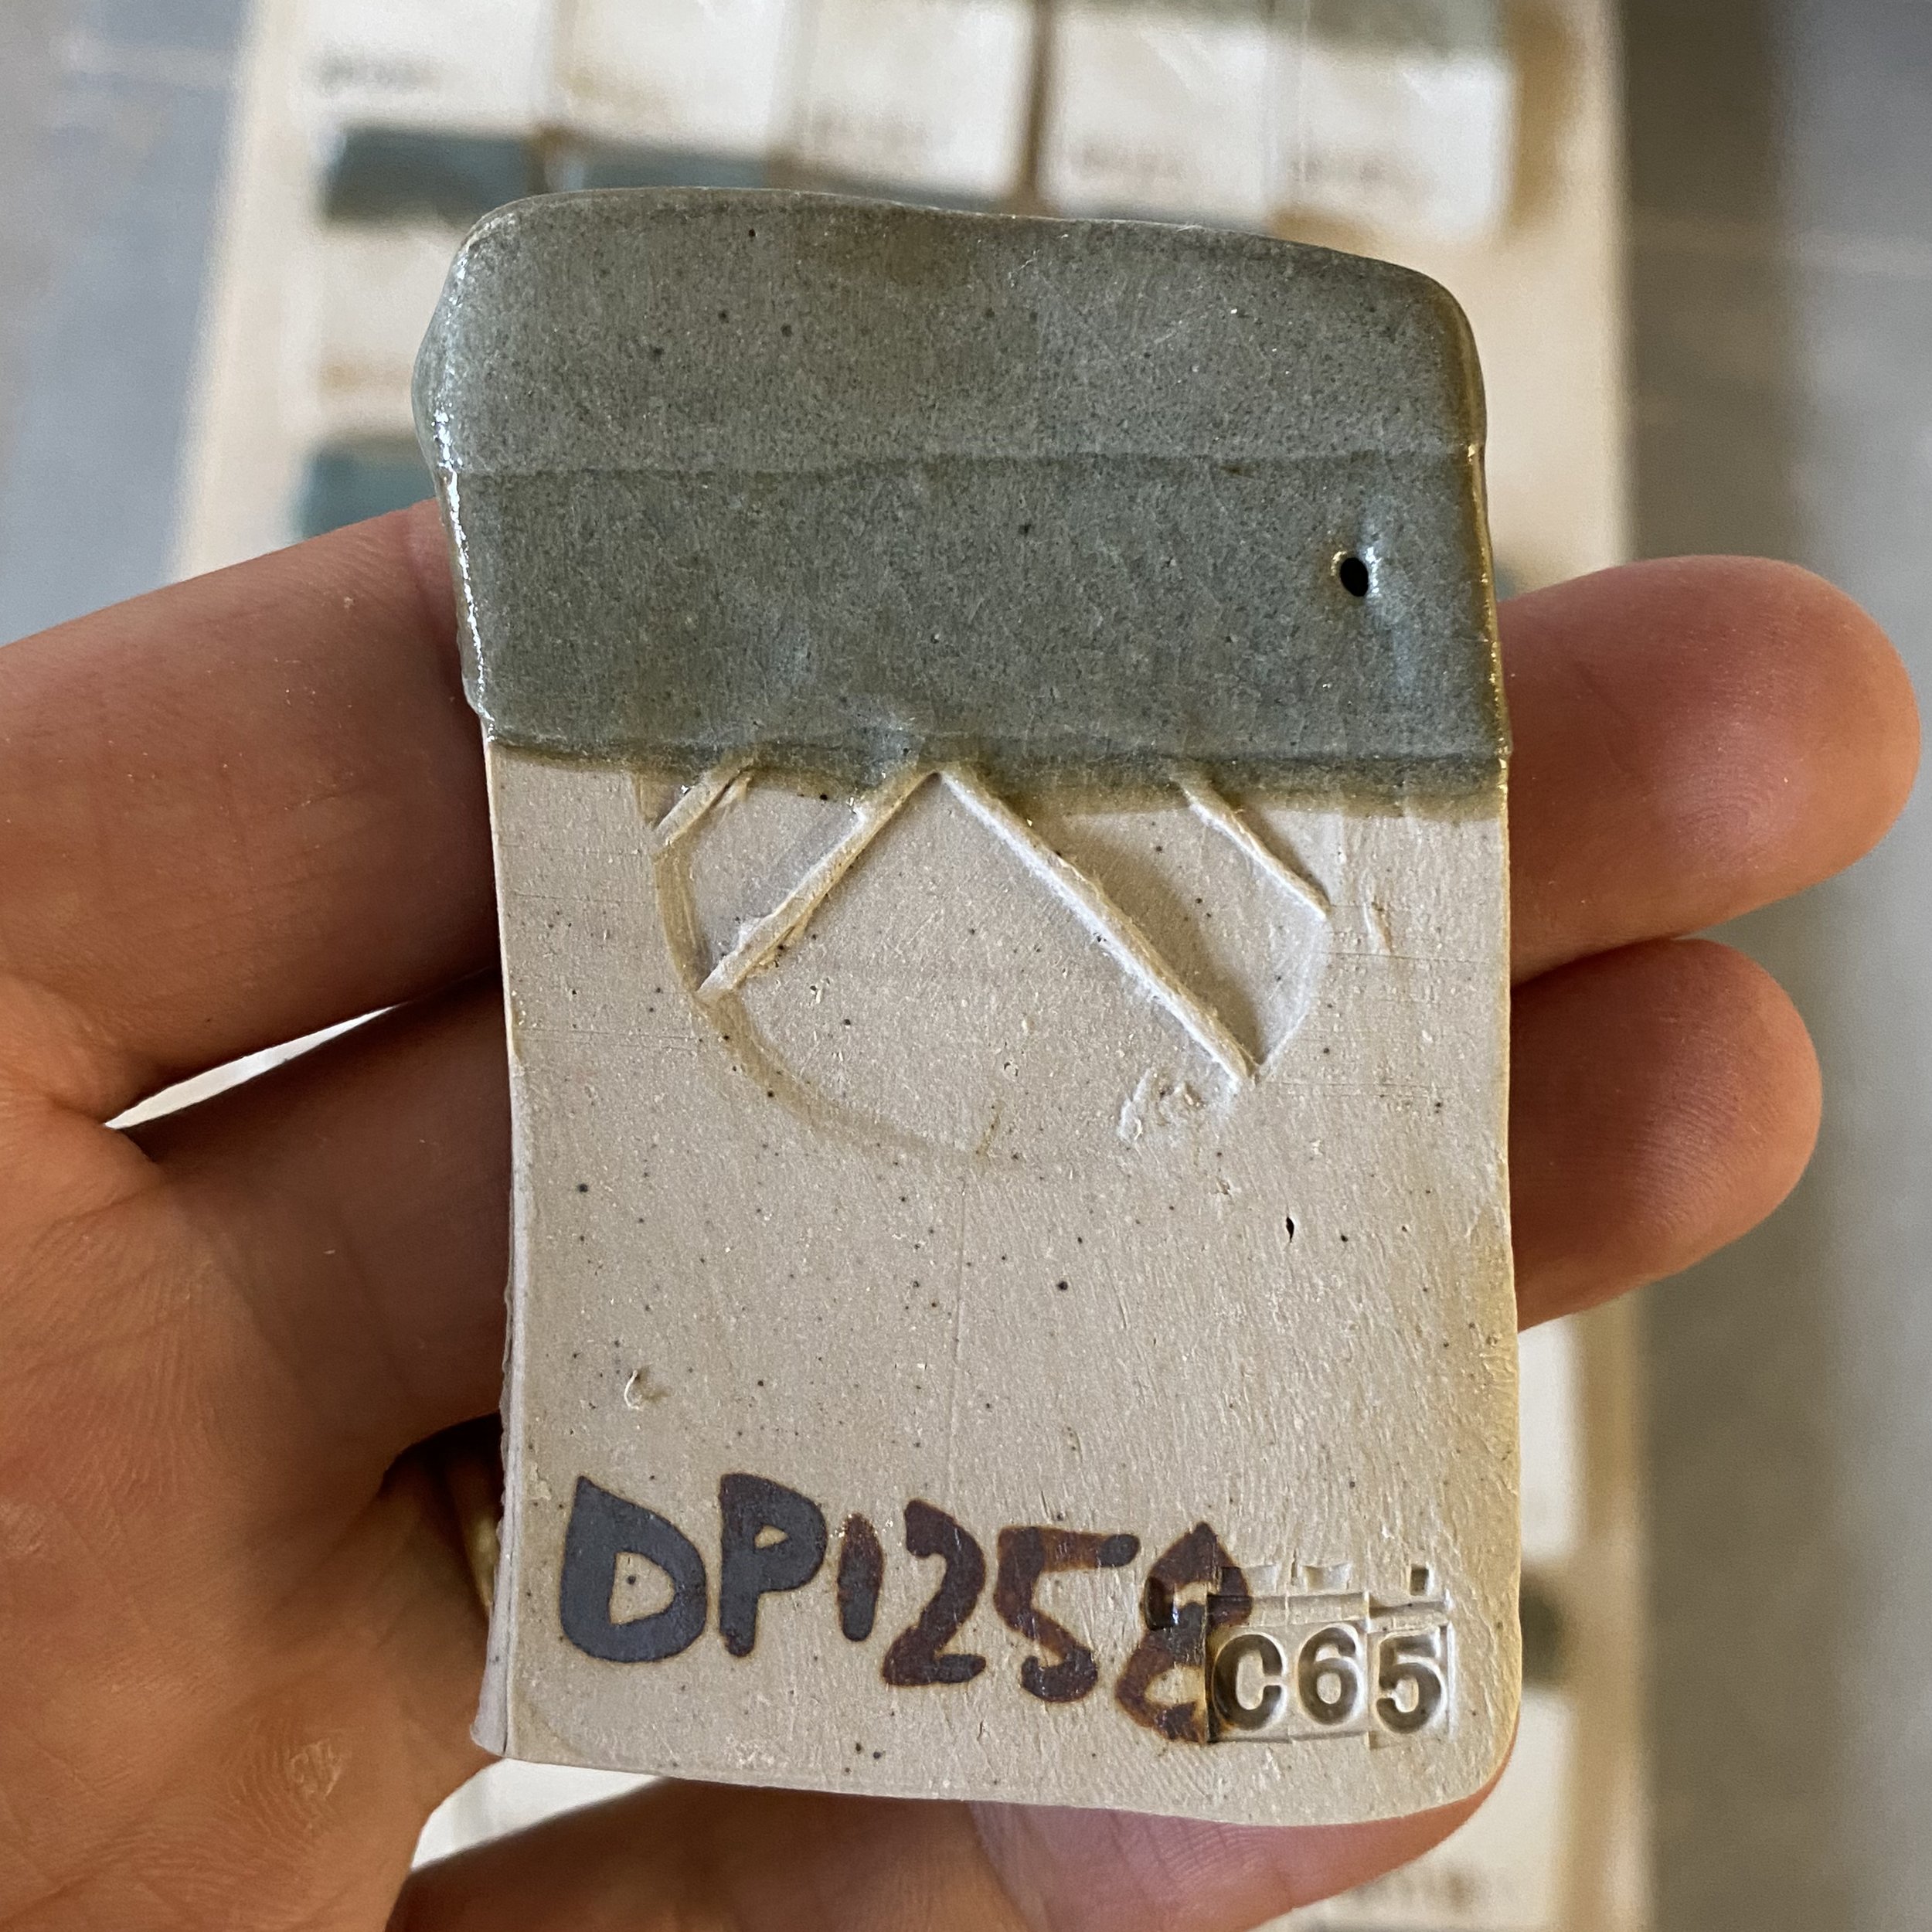
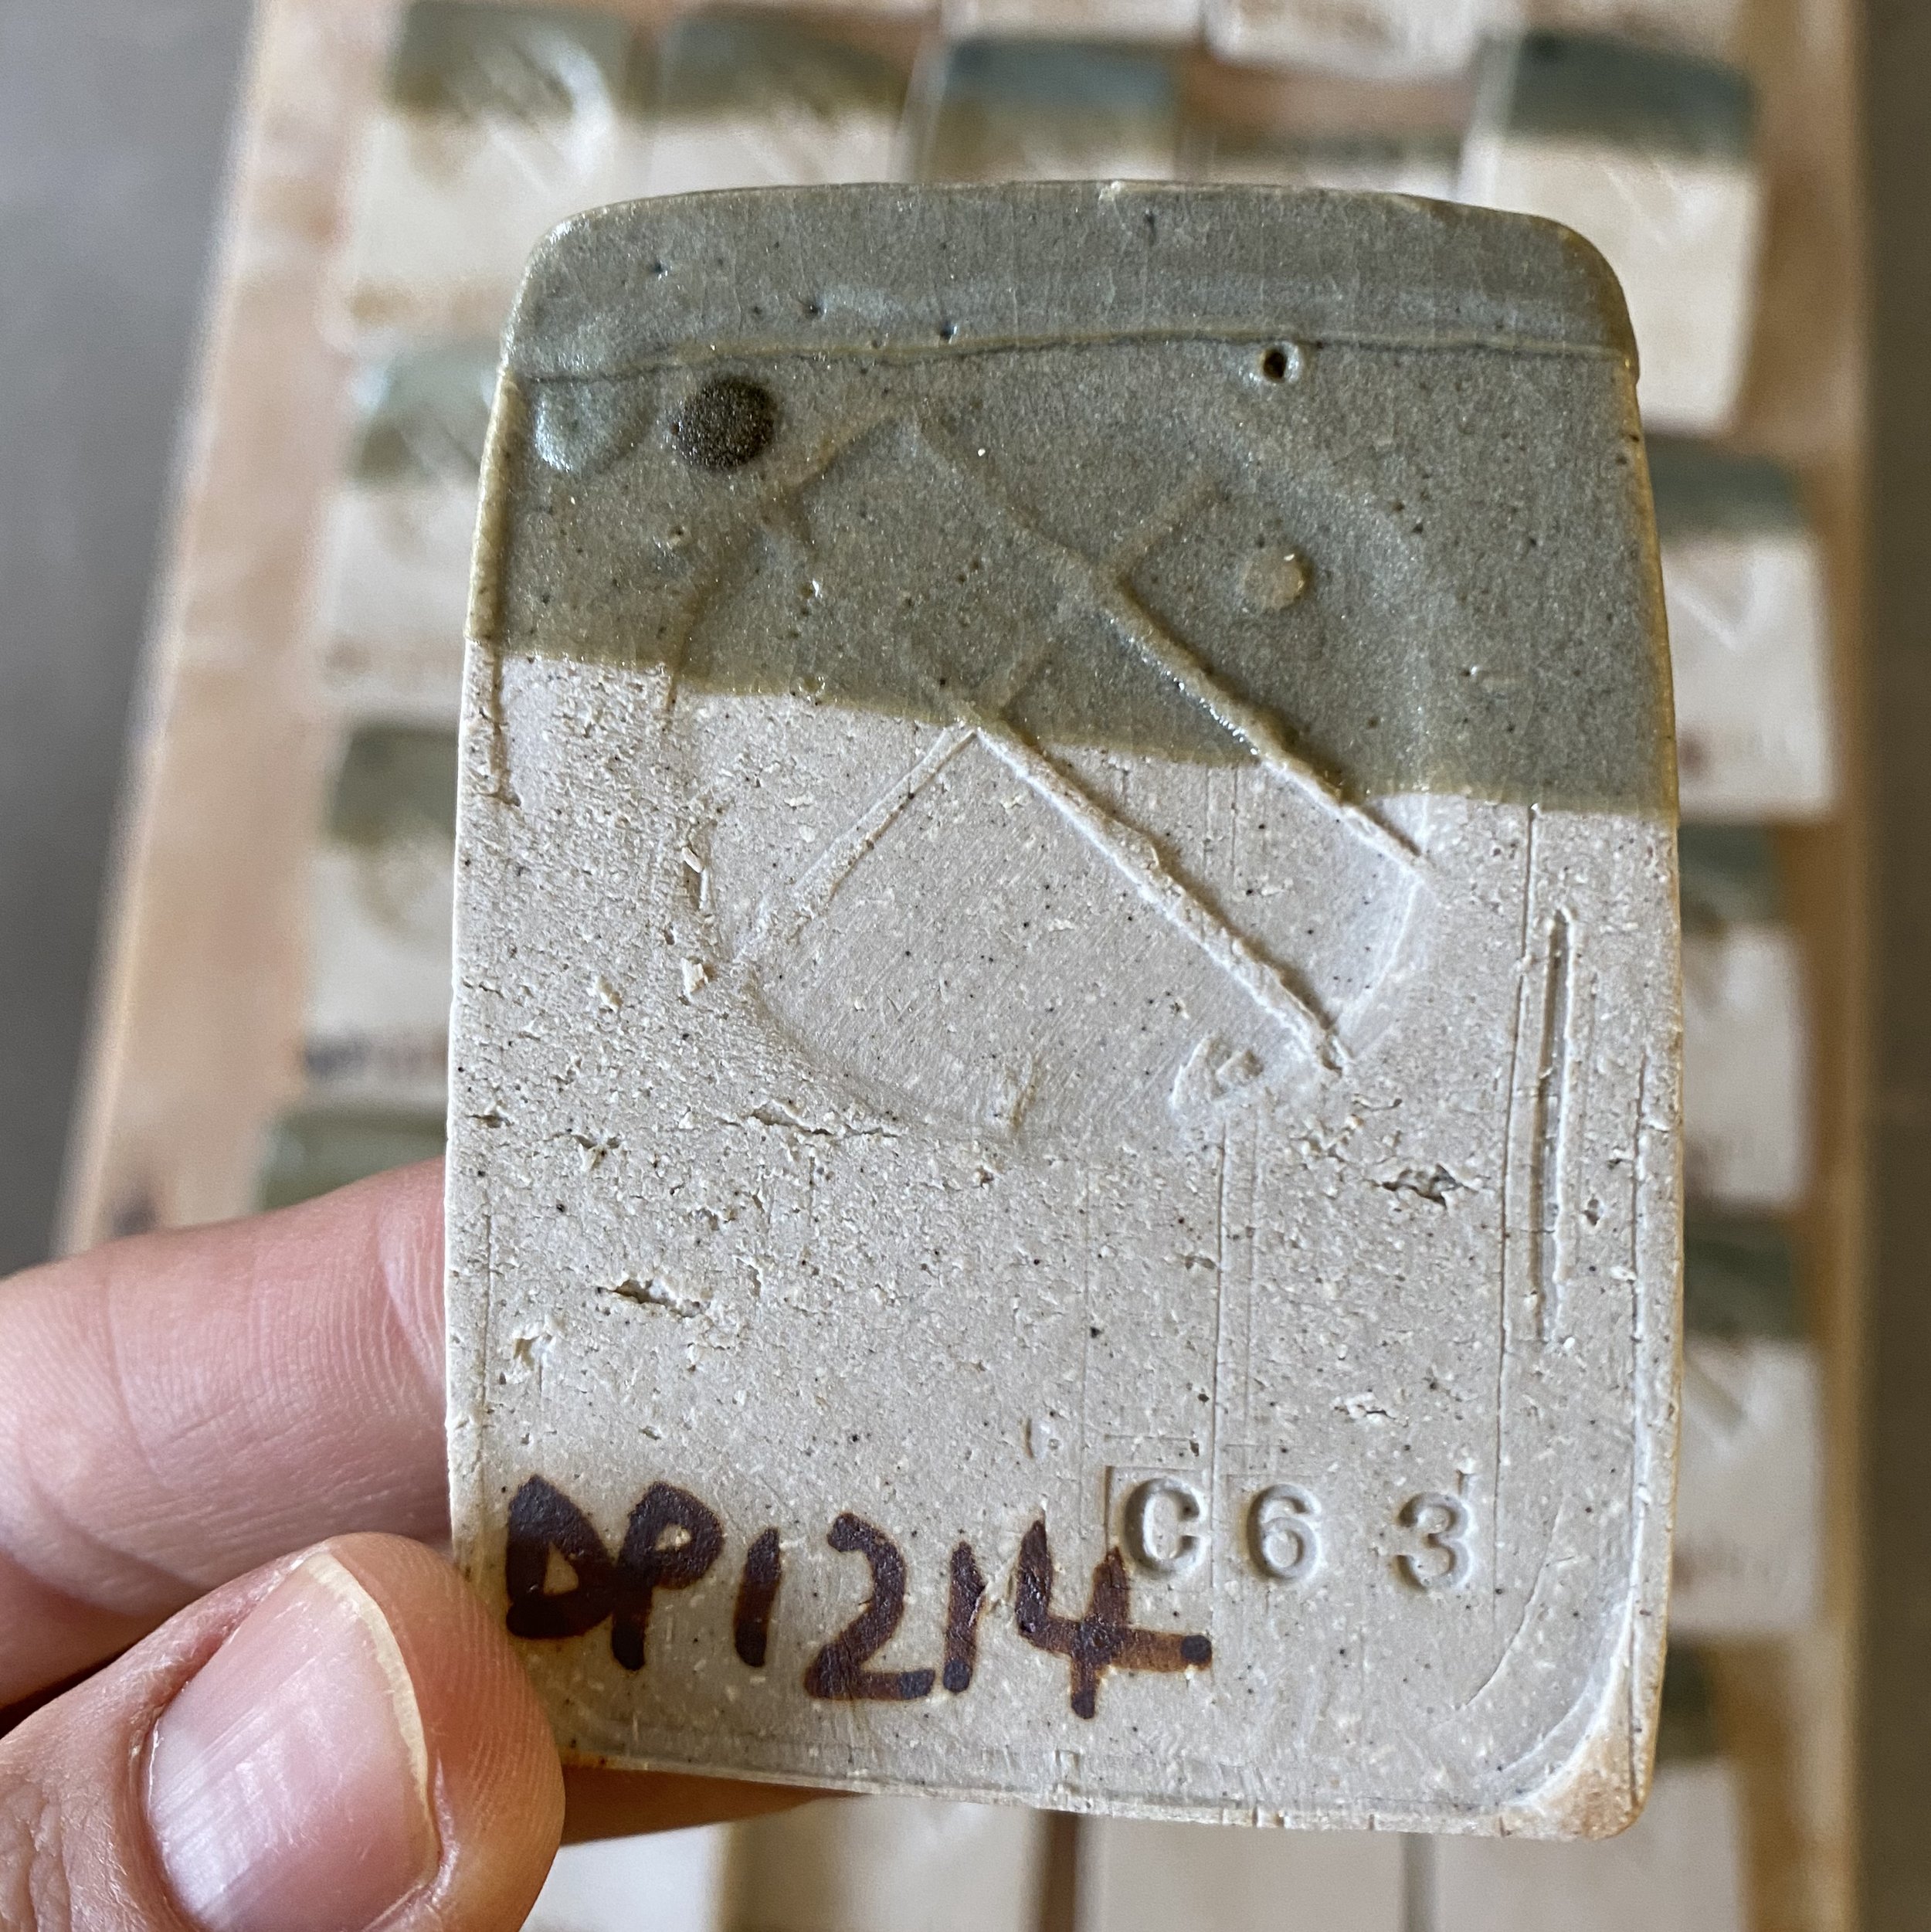
The oxidised tiles are green and do not show much opalescence, whereas the reduced tiles are quite promising, all across the grid. You can see on some of the tiles that half of the tile got more reduction than the other half, such as DP1266 here…
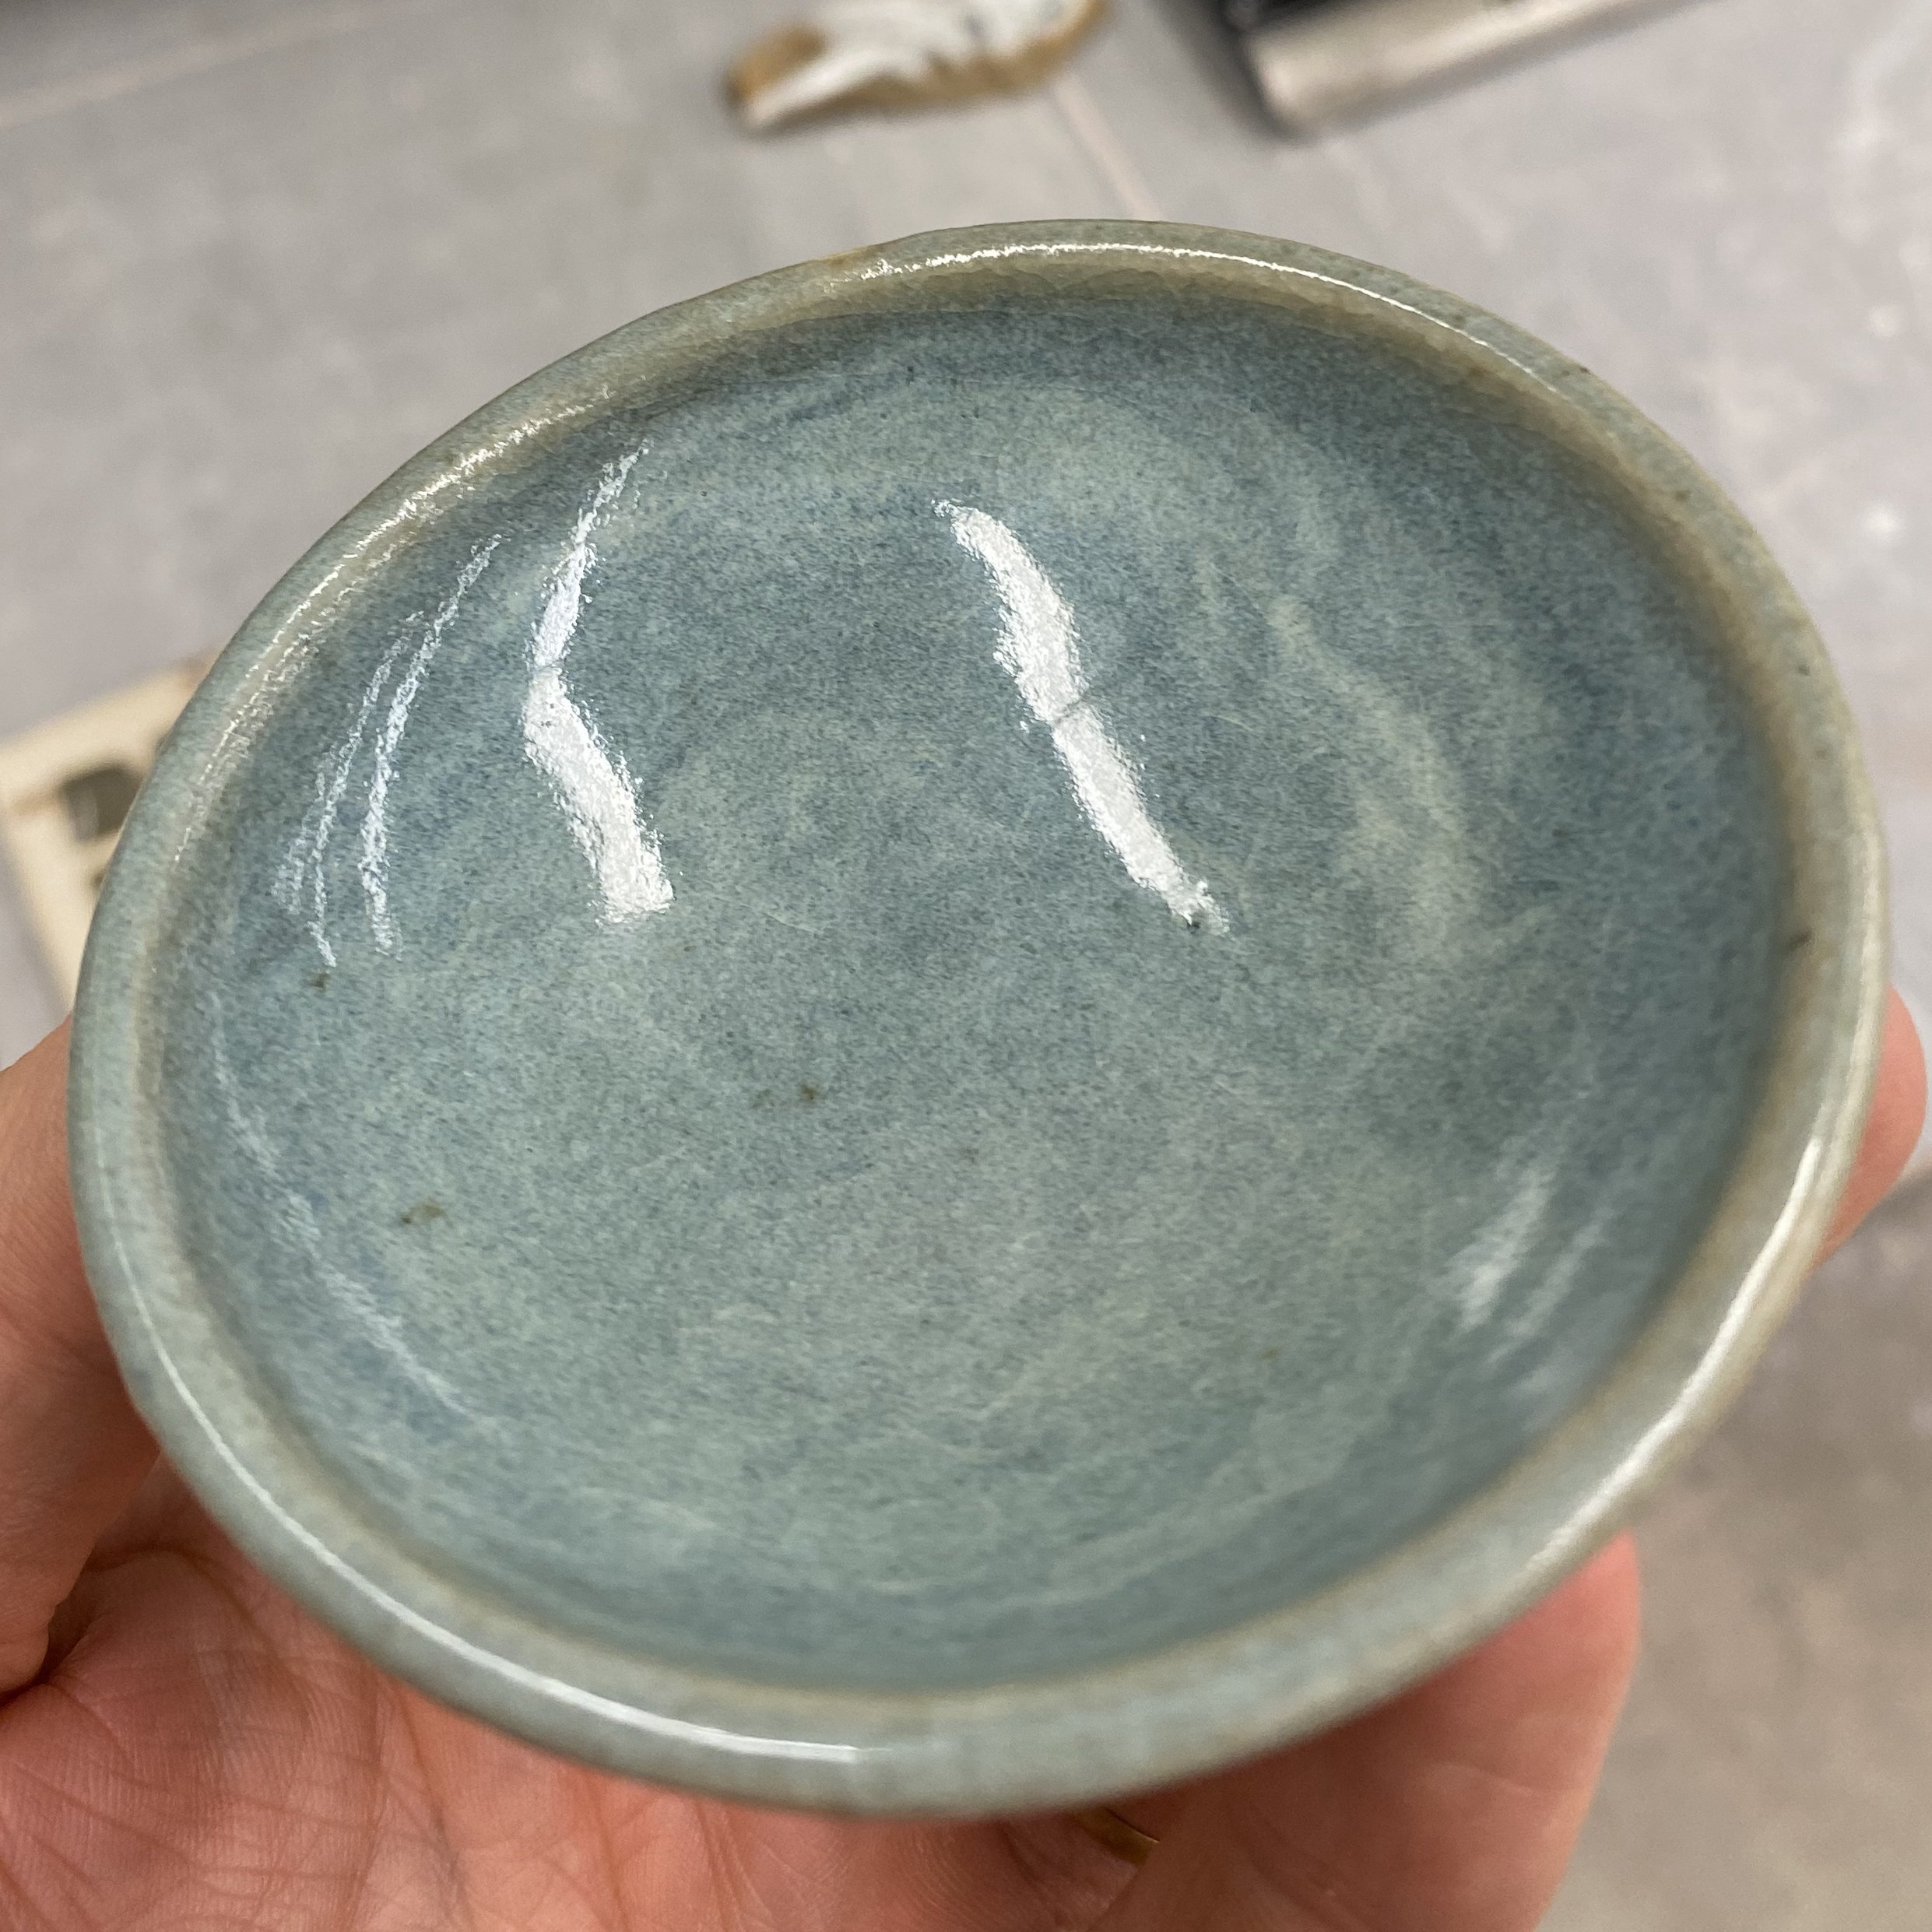
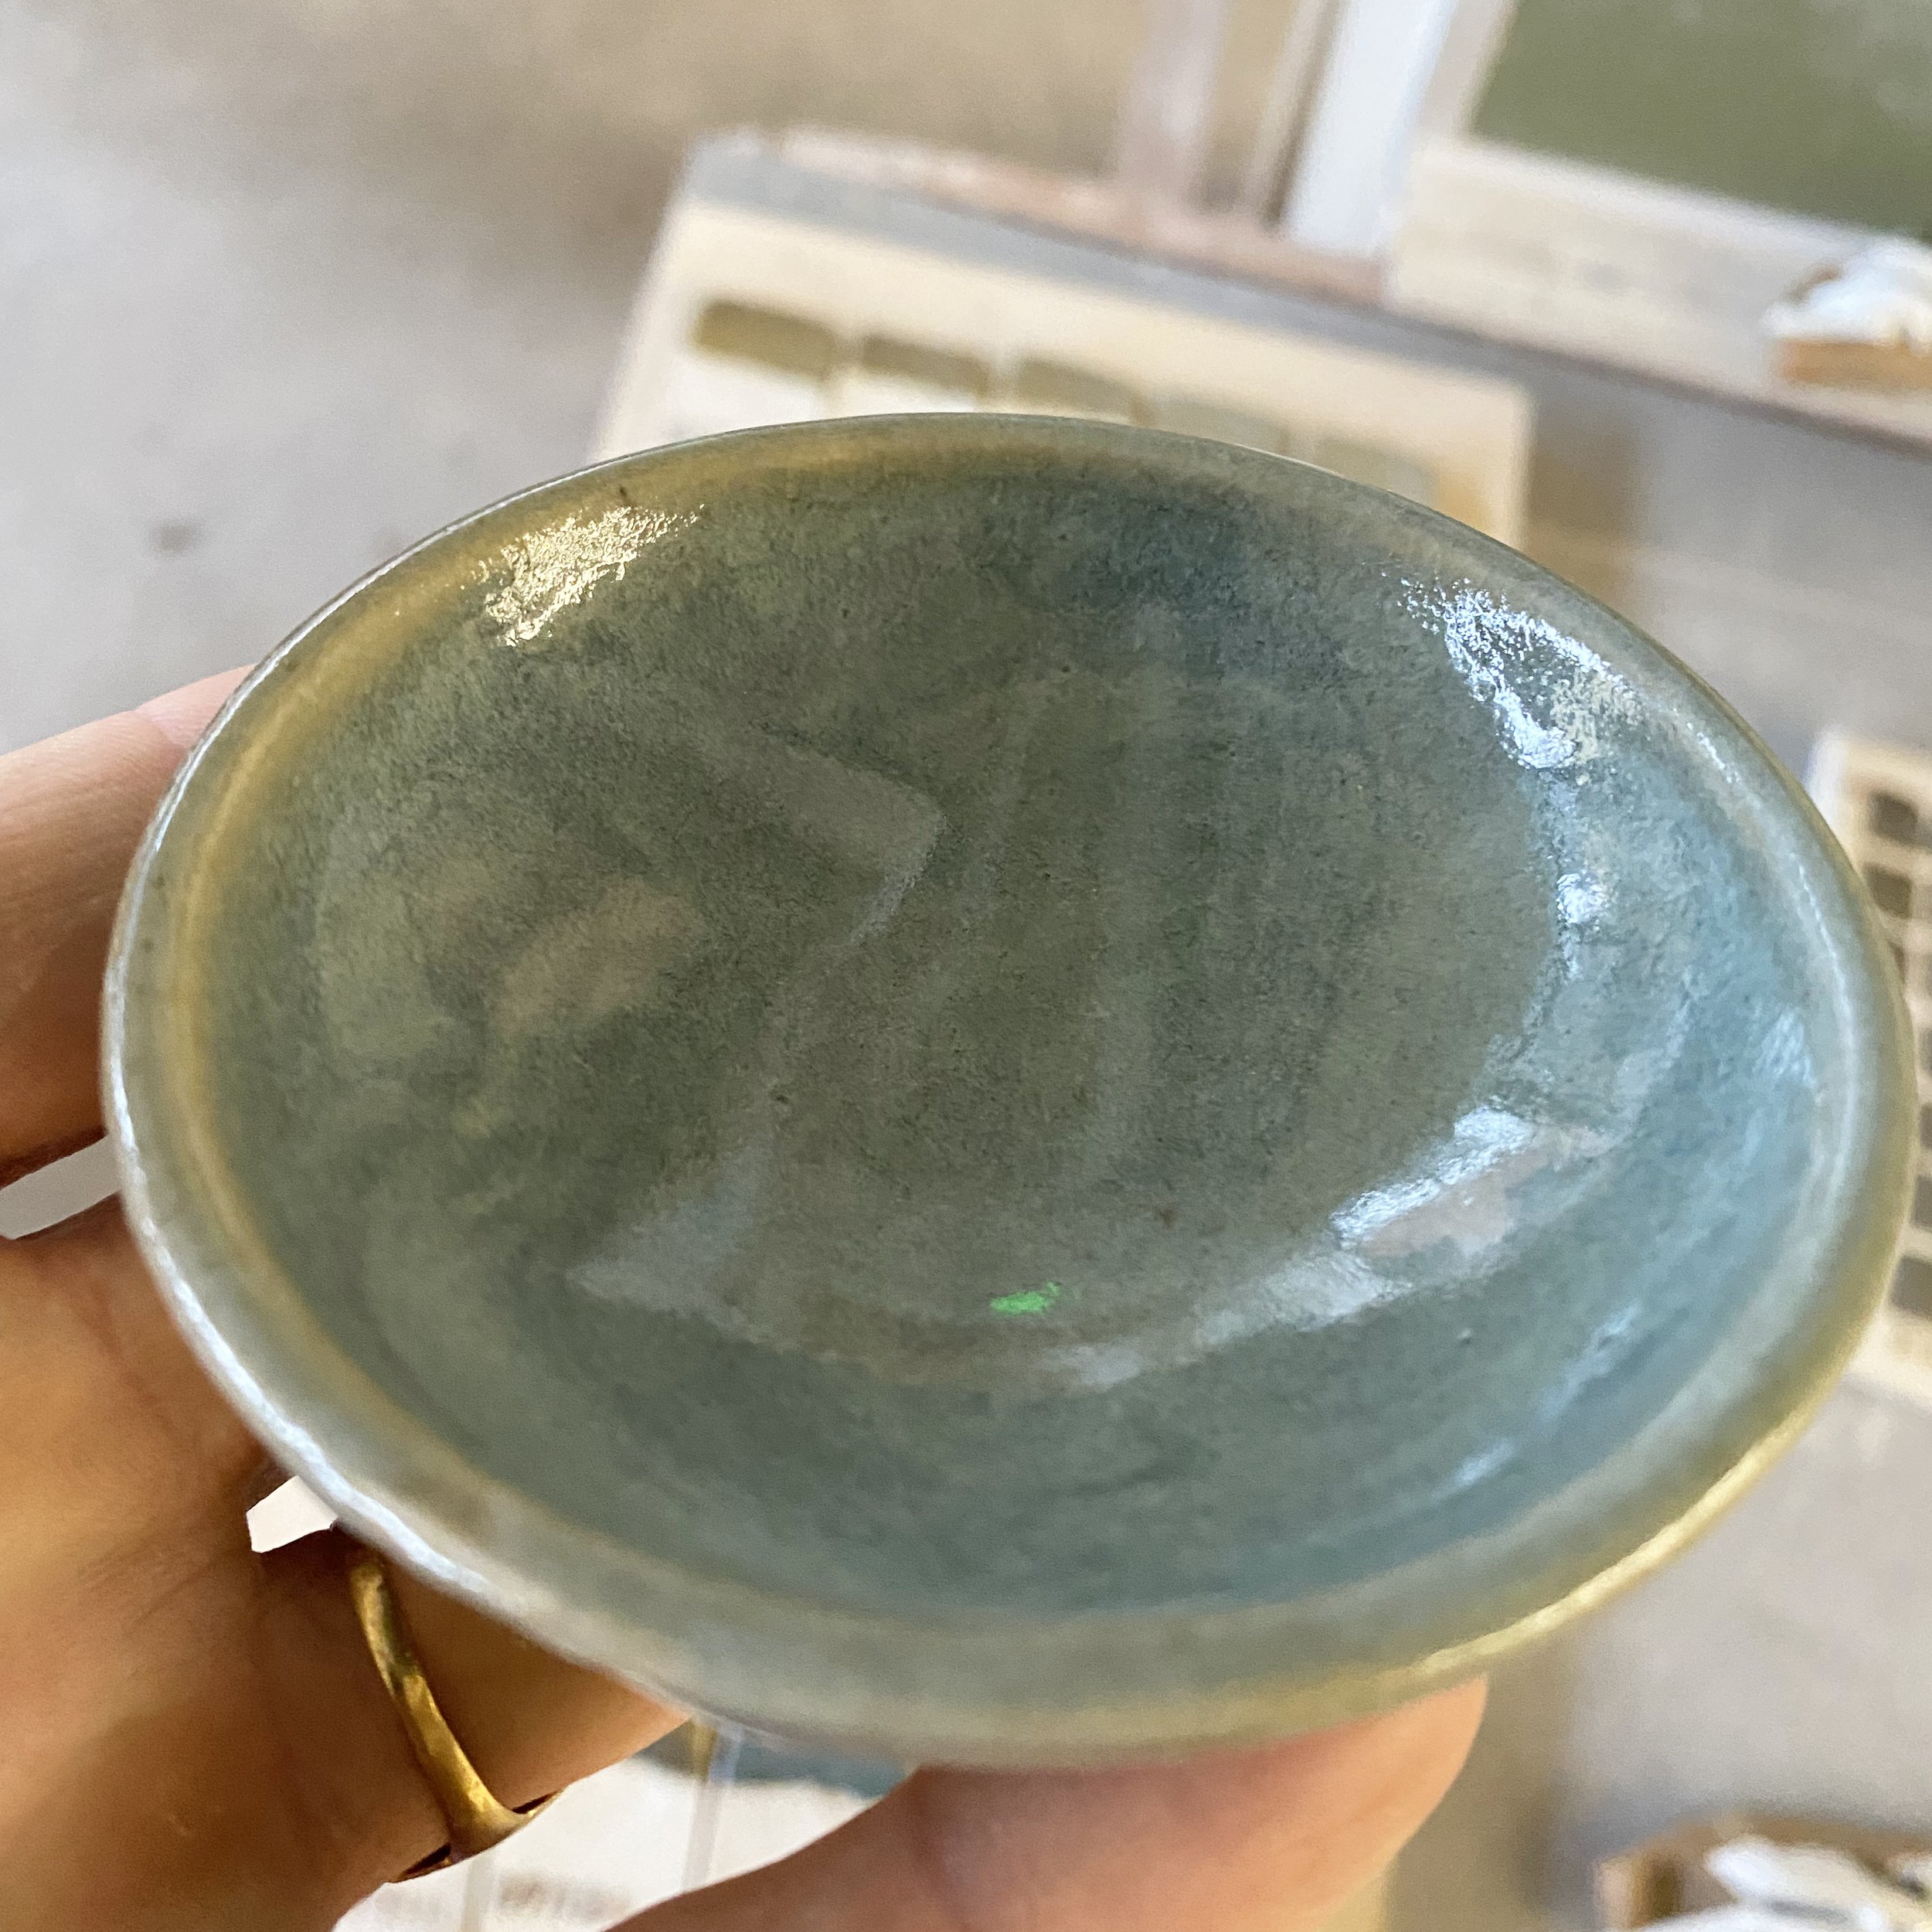
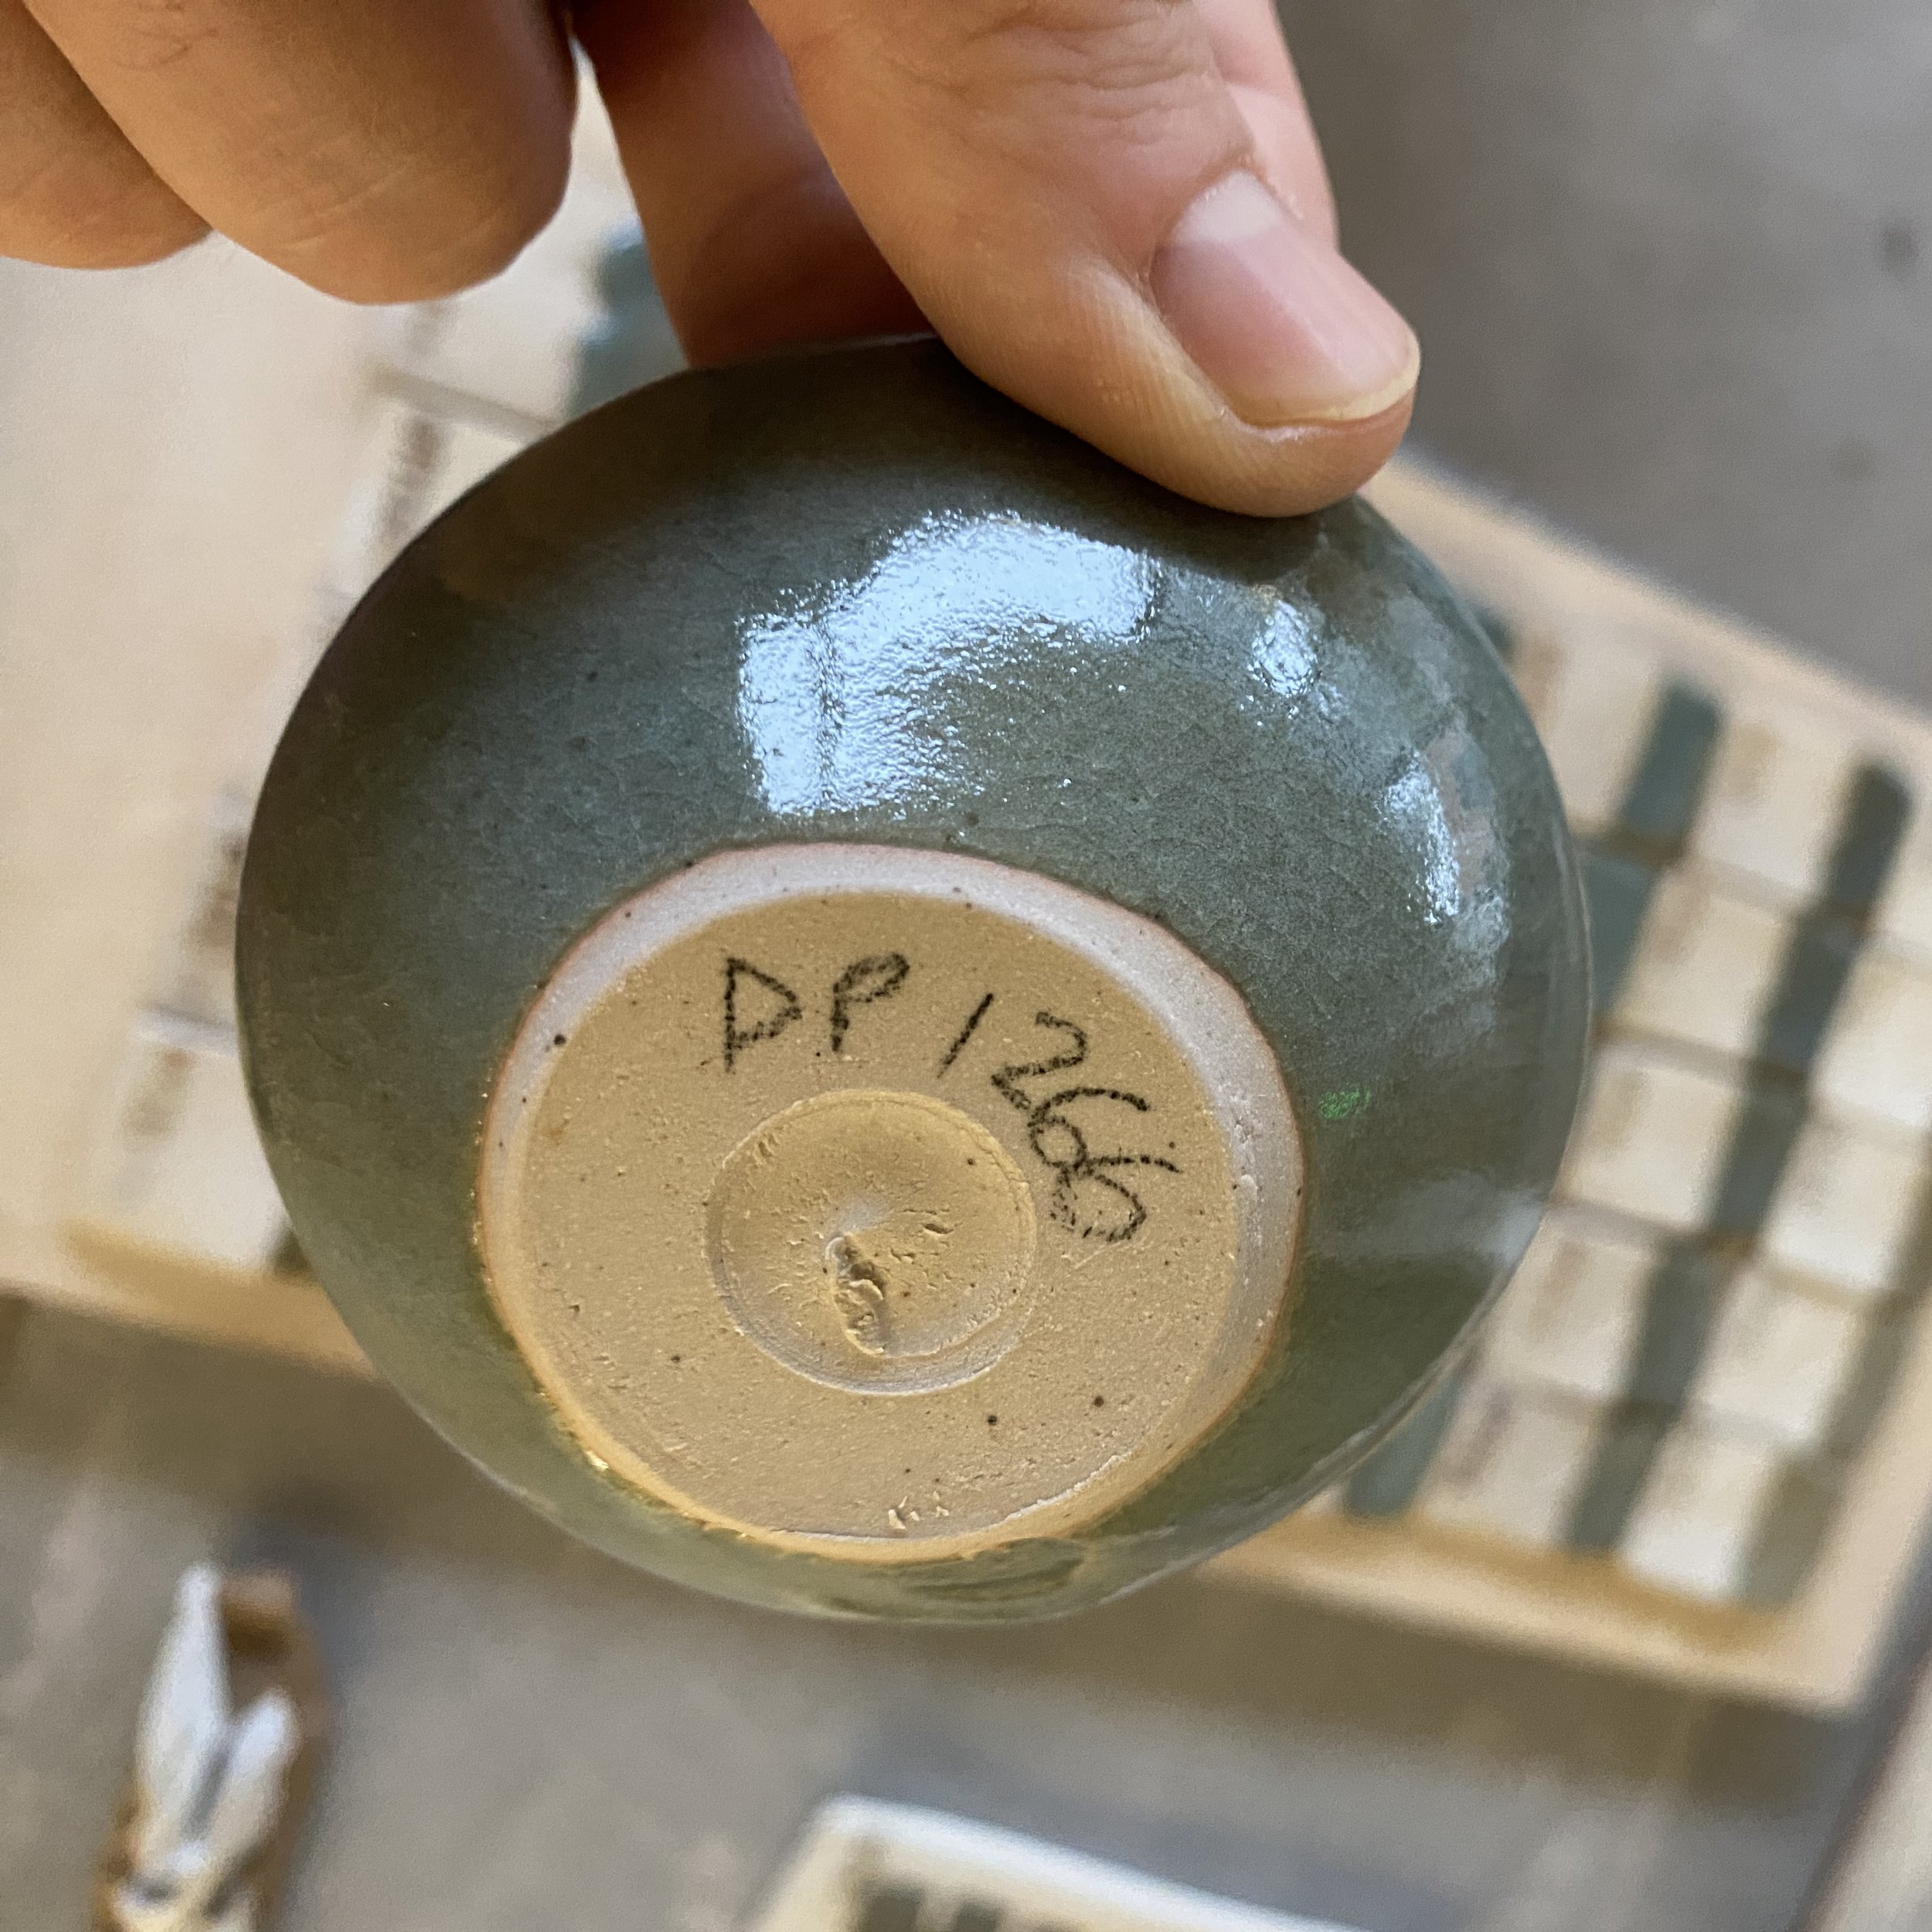
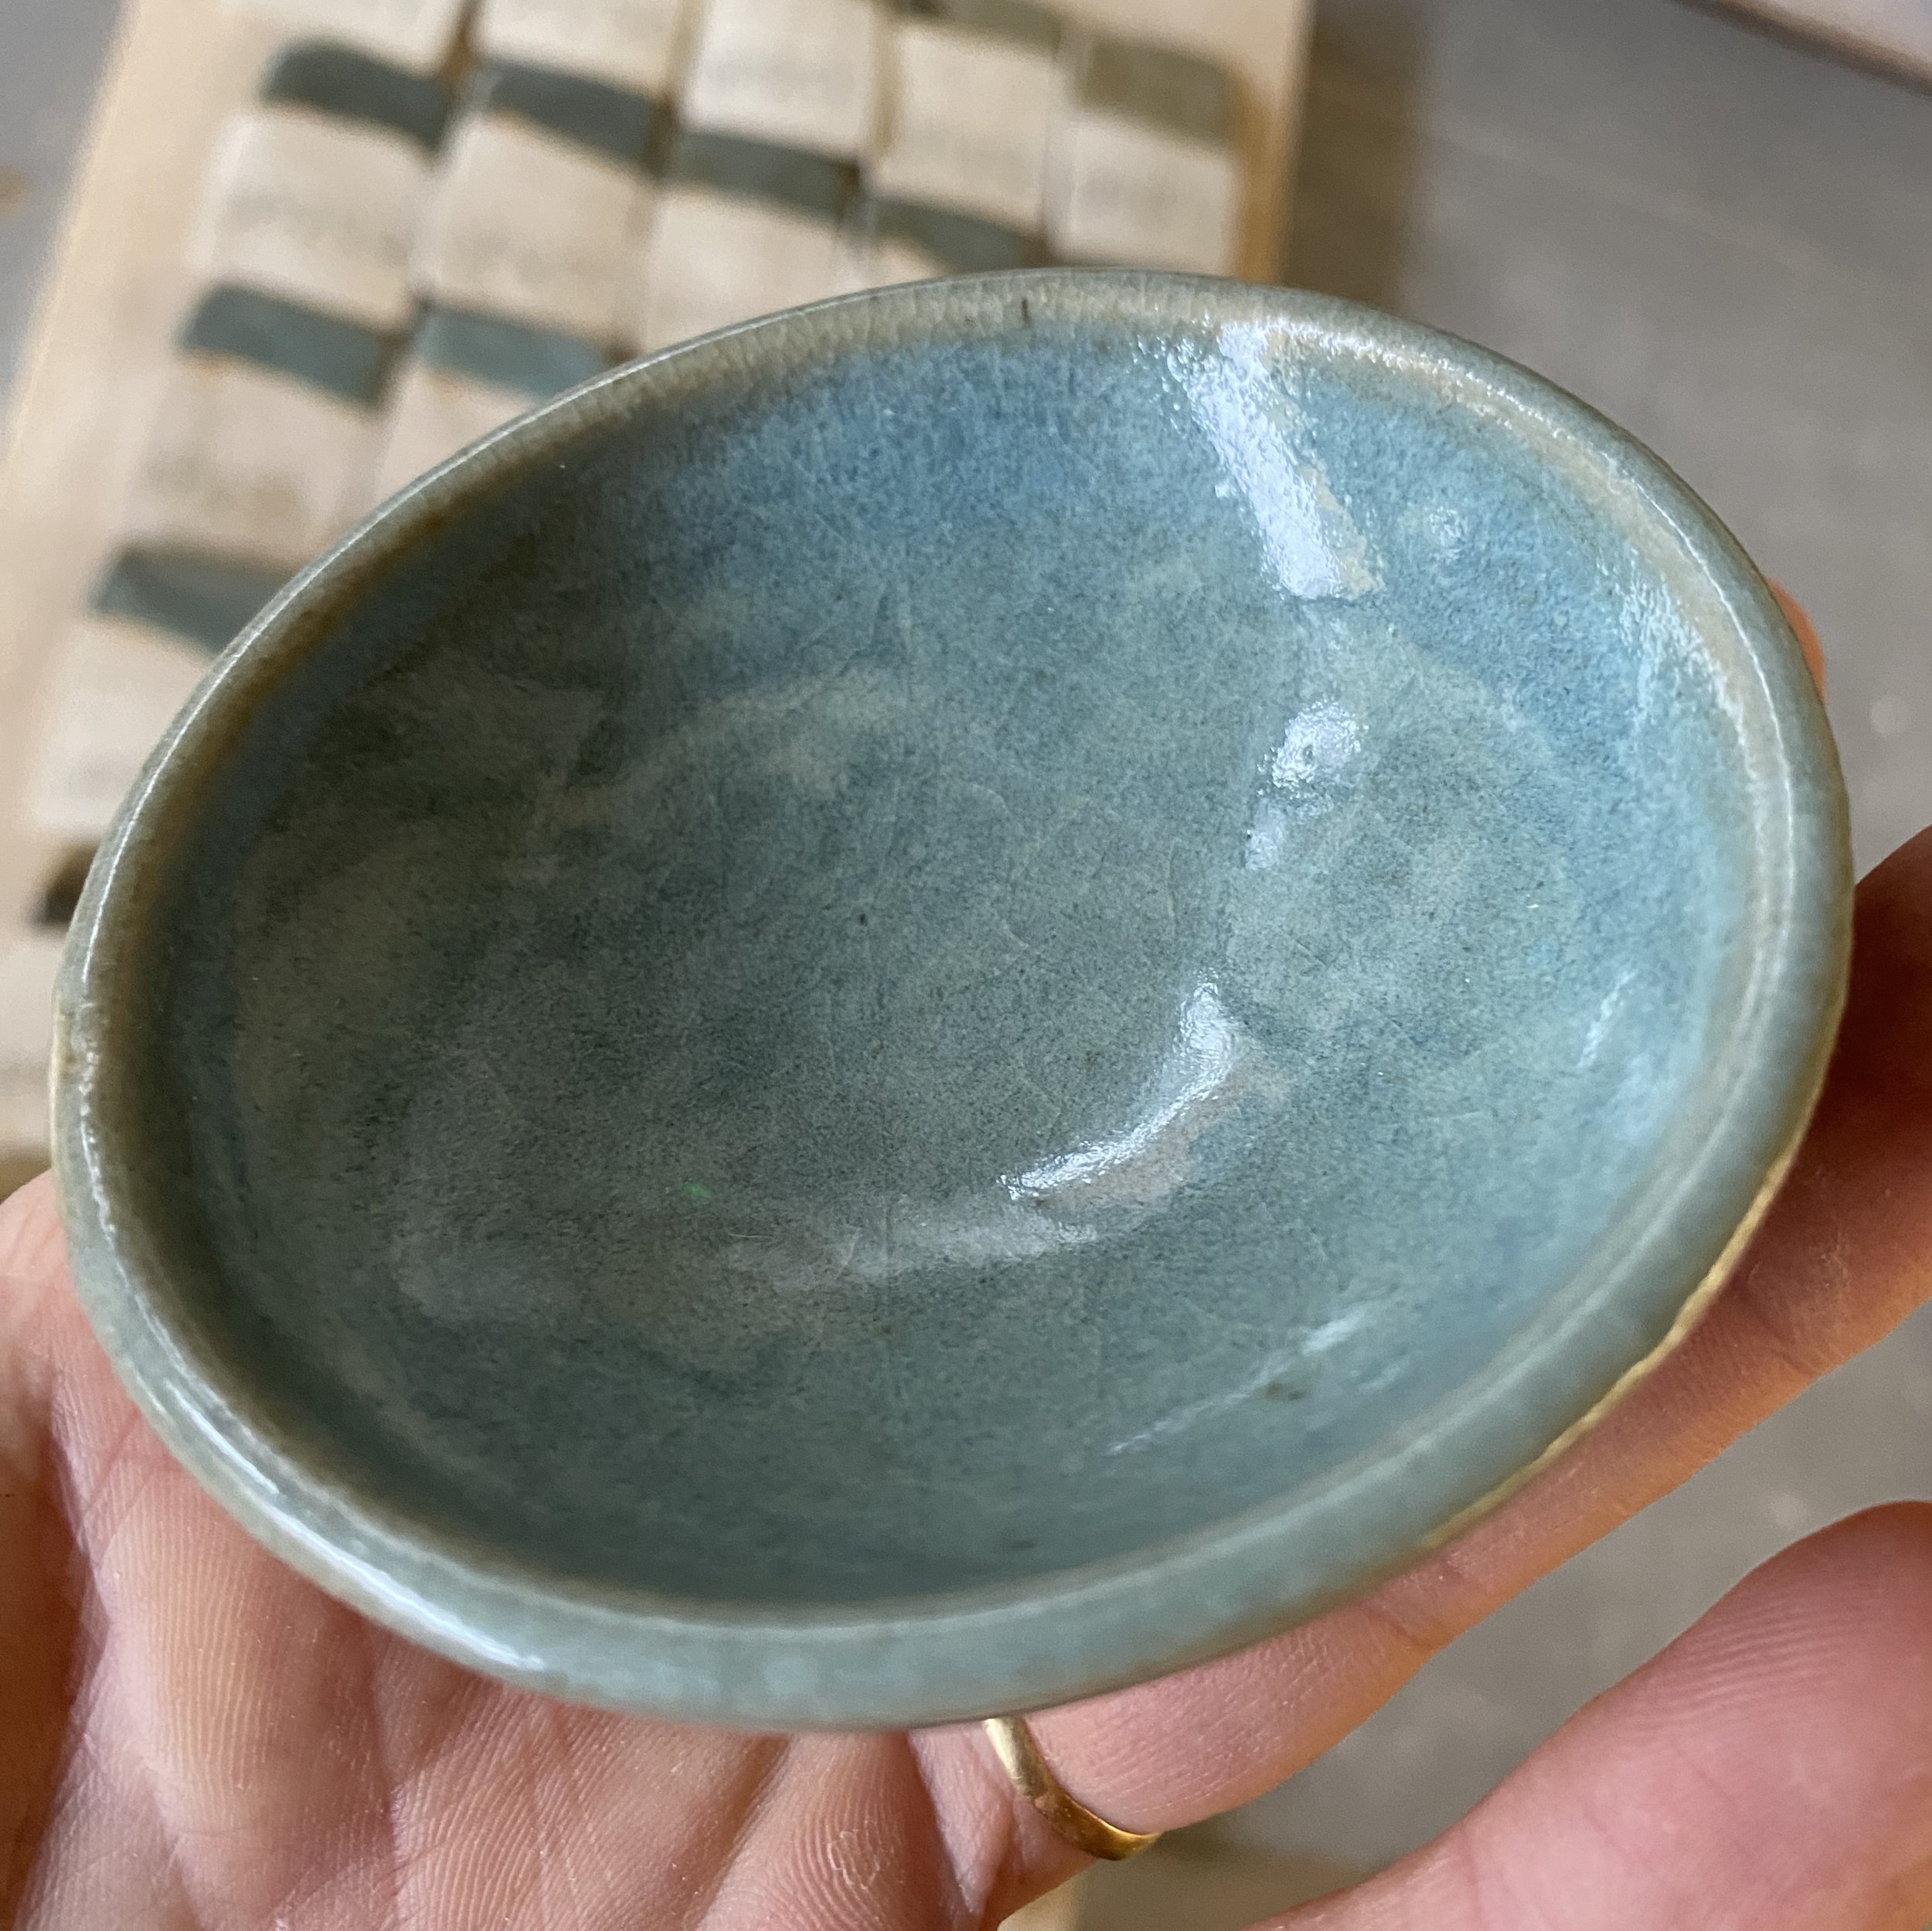
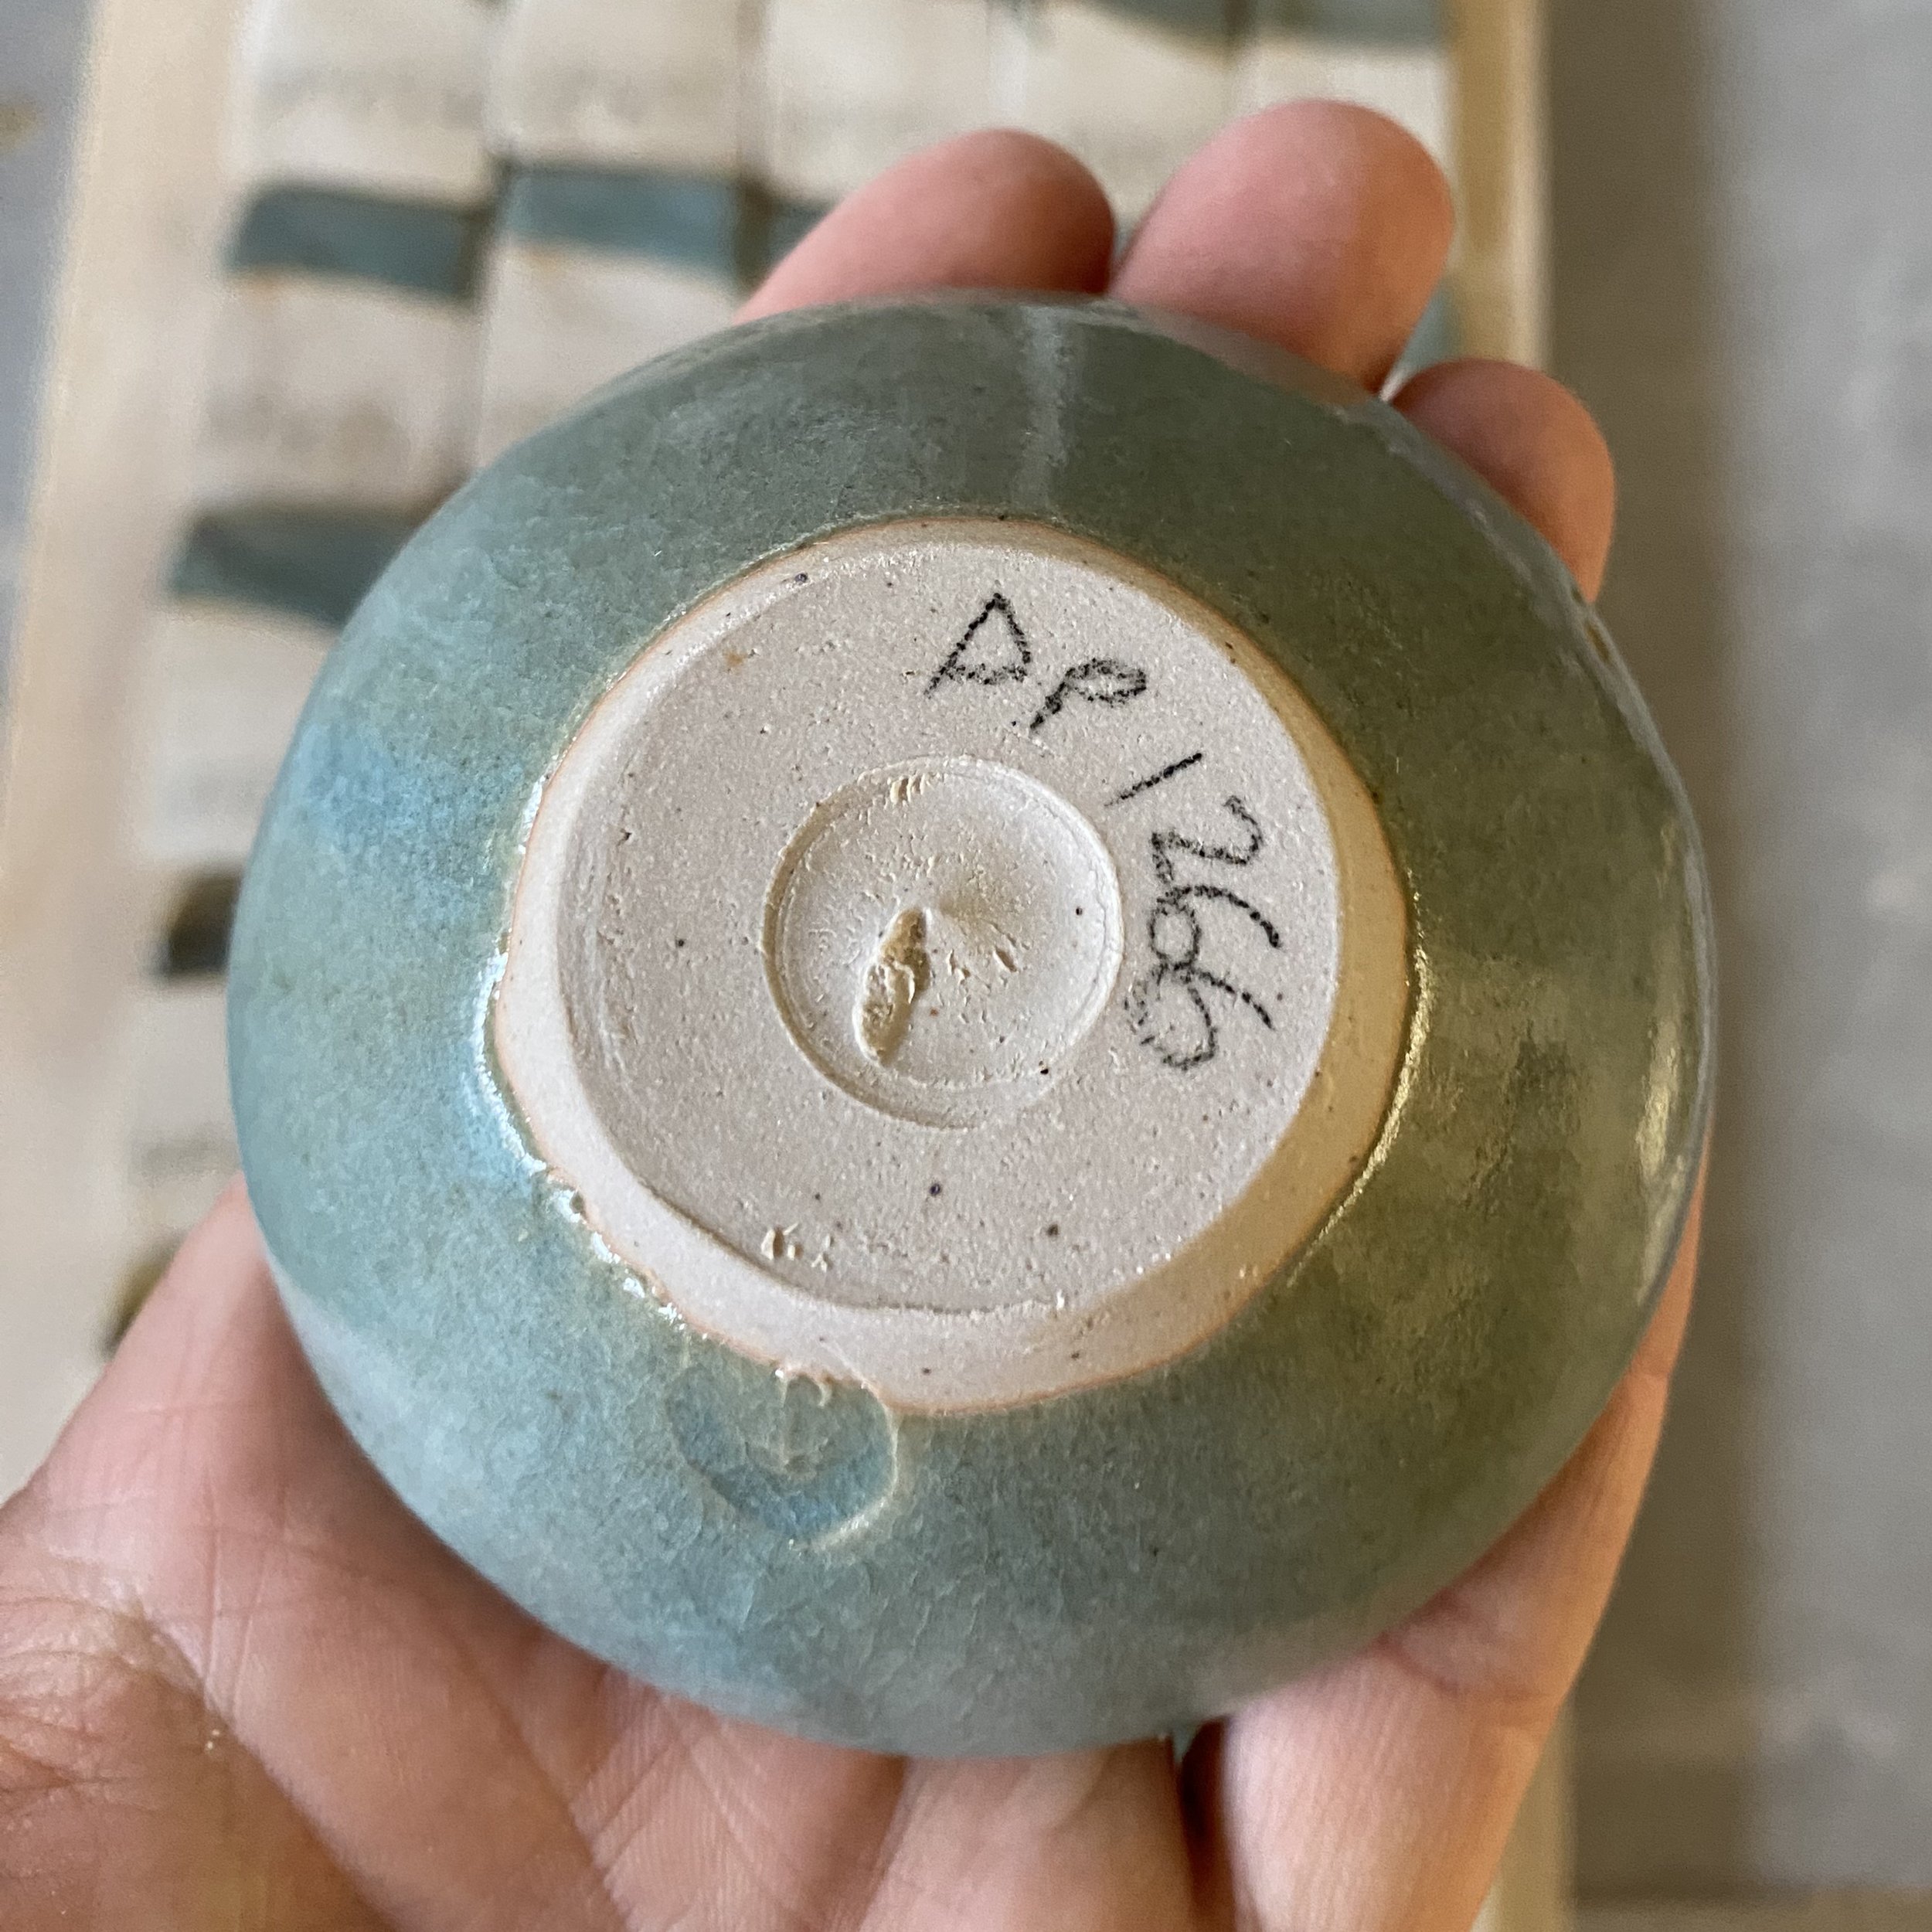
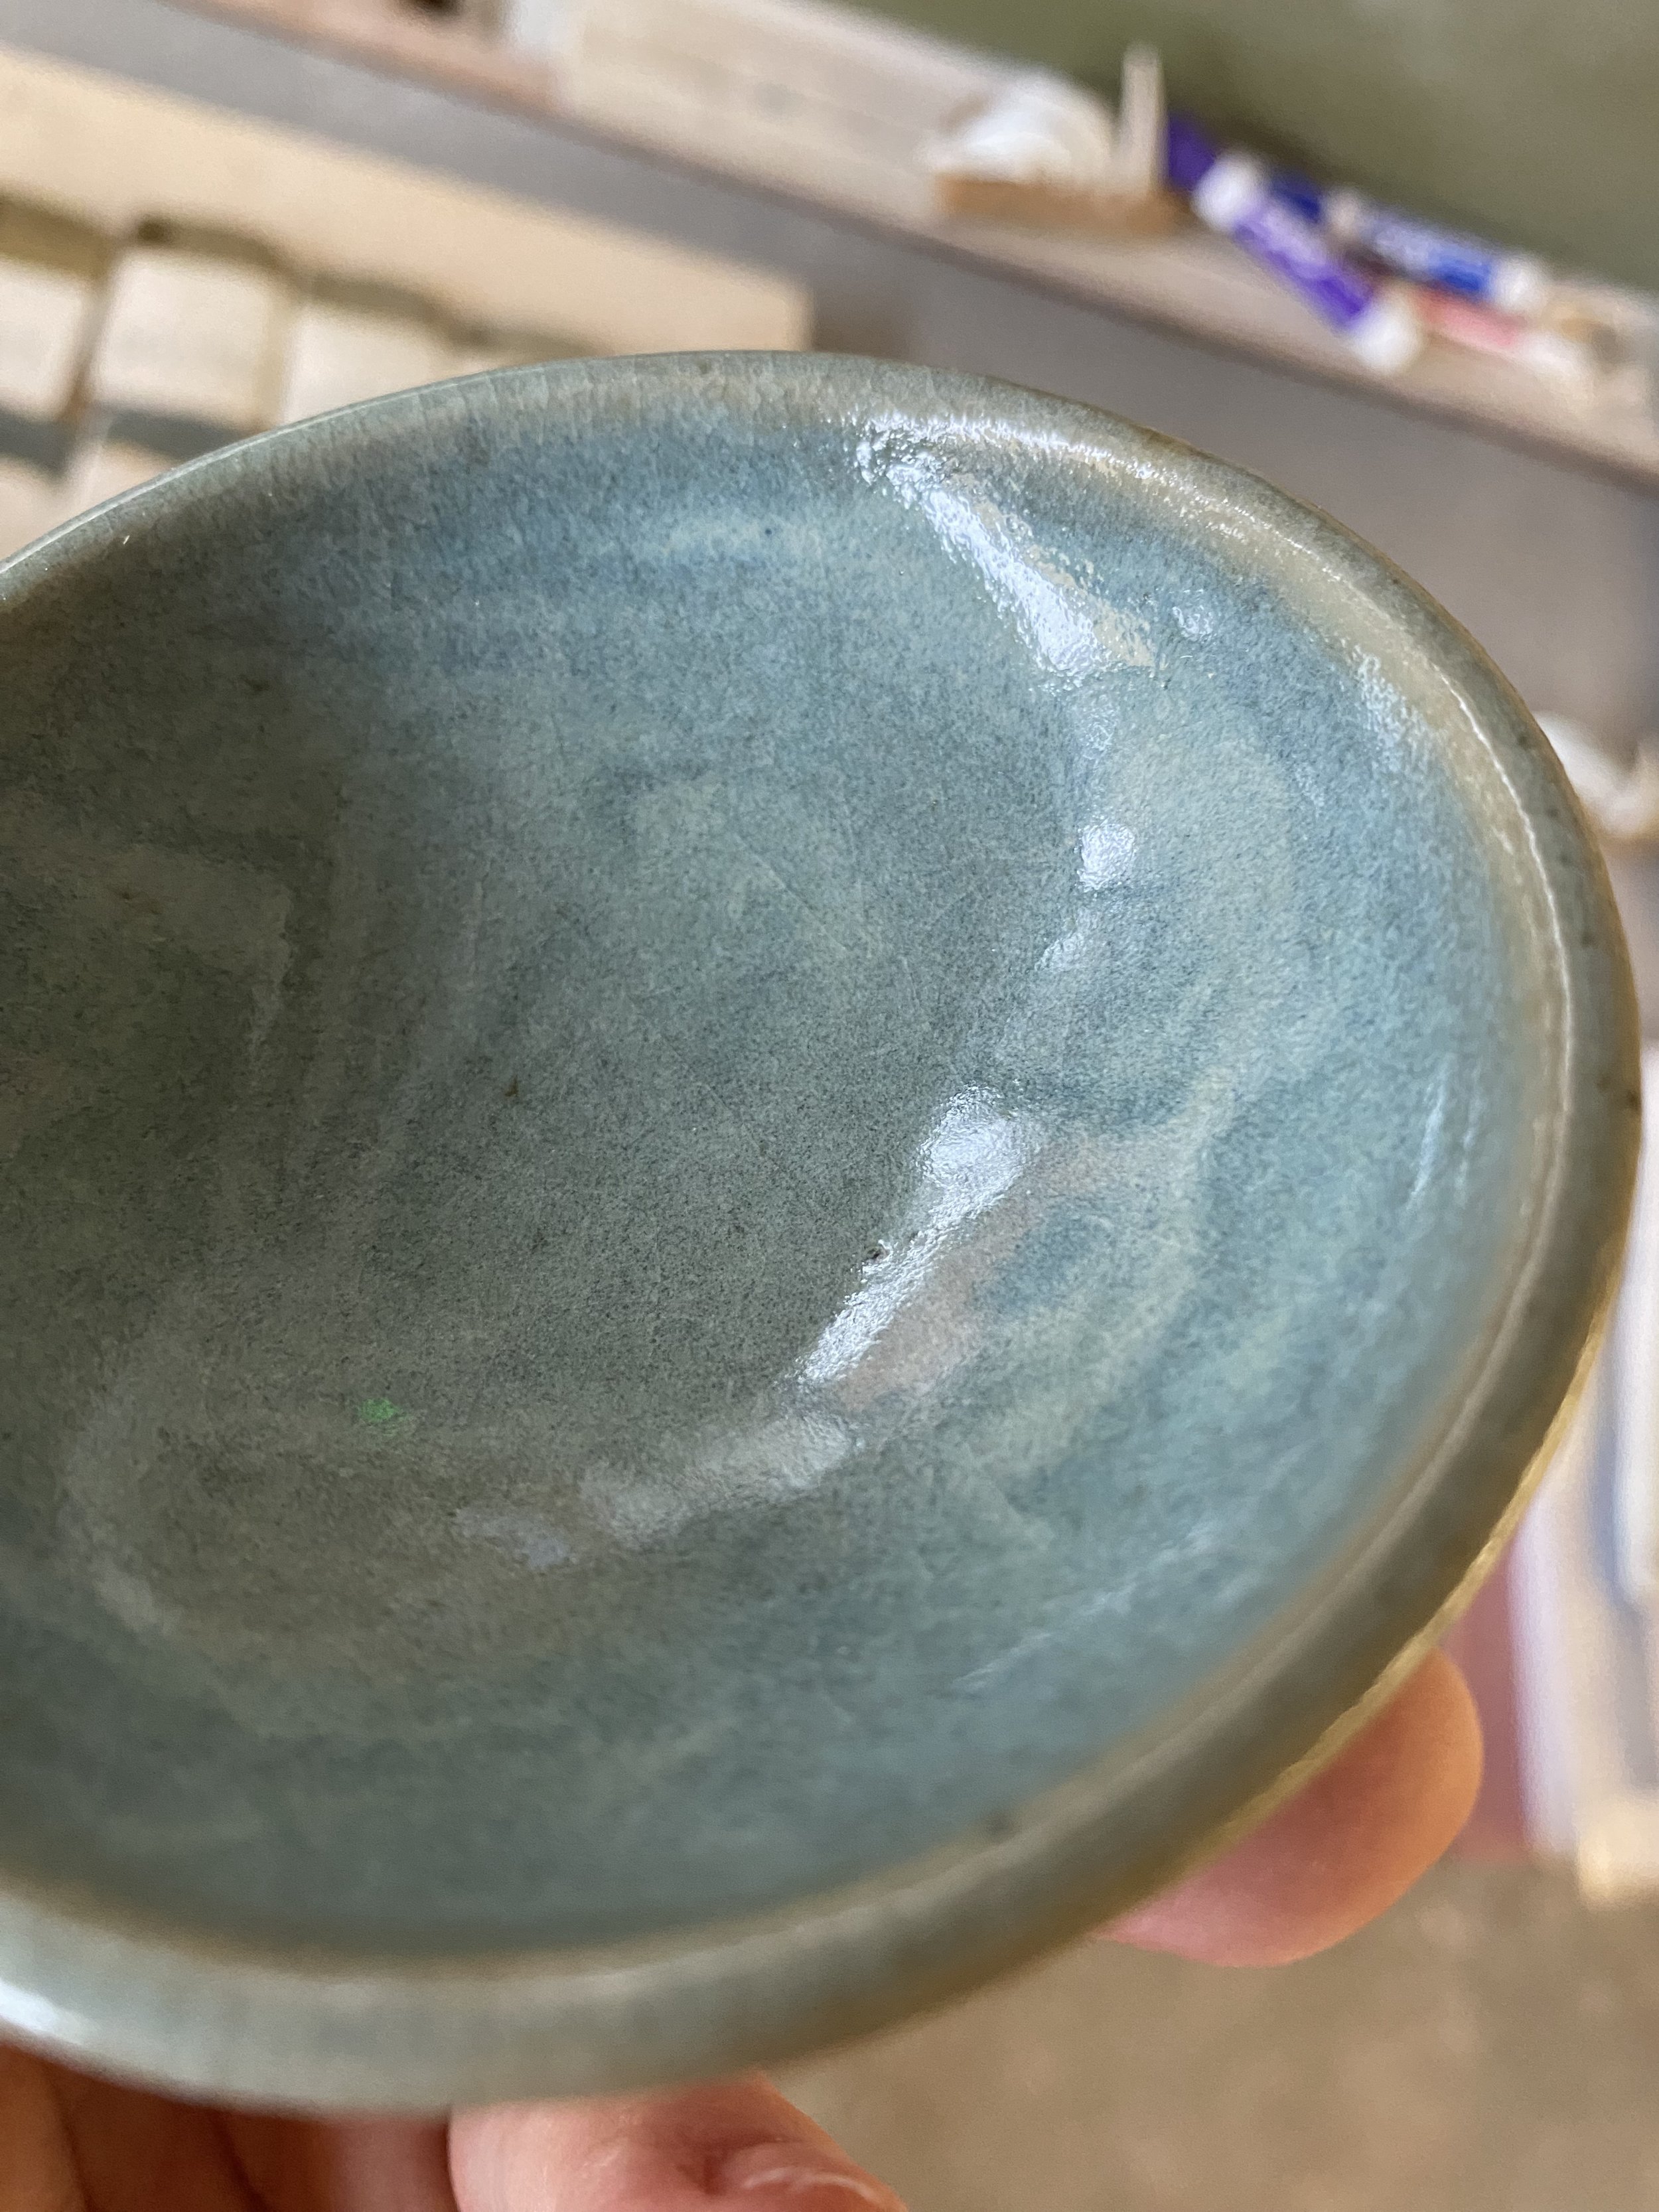
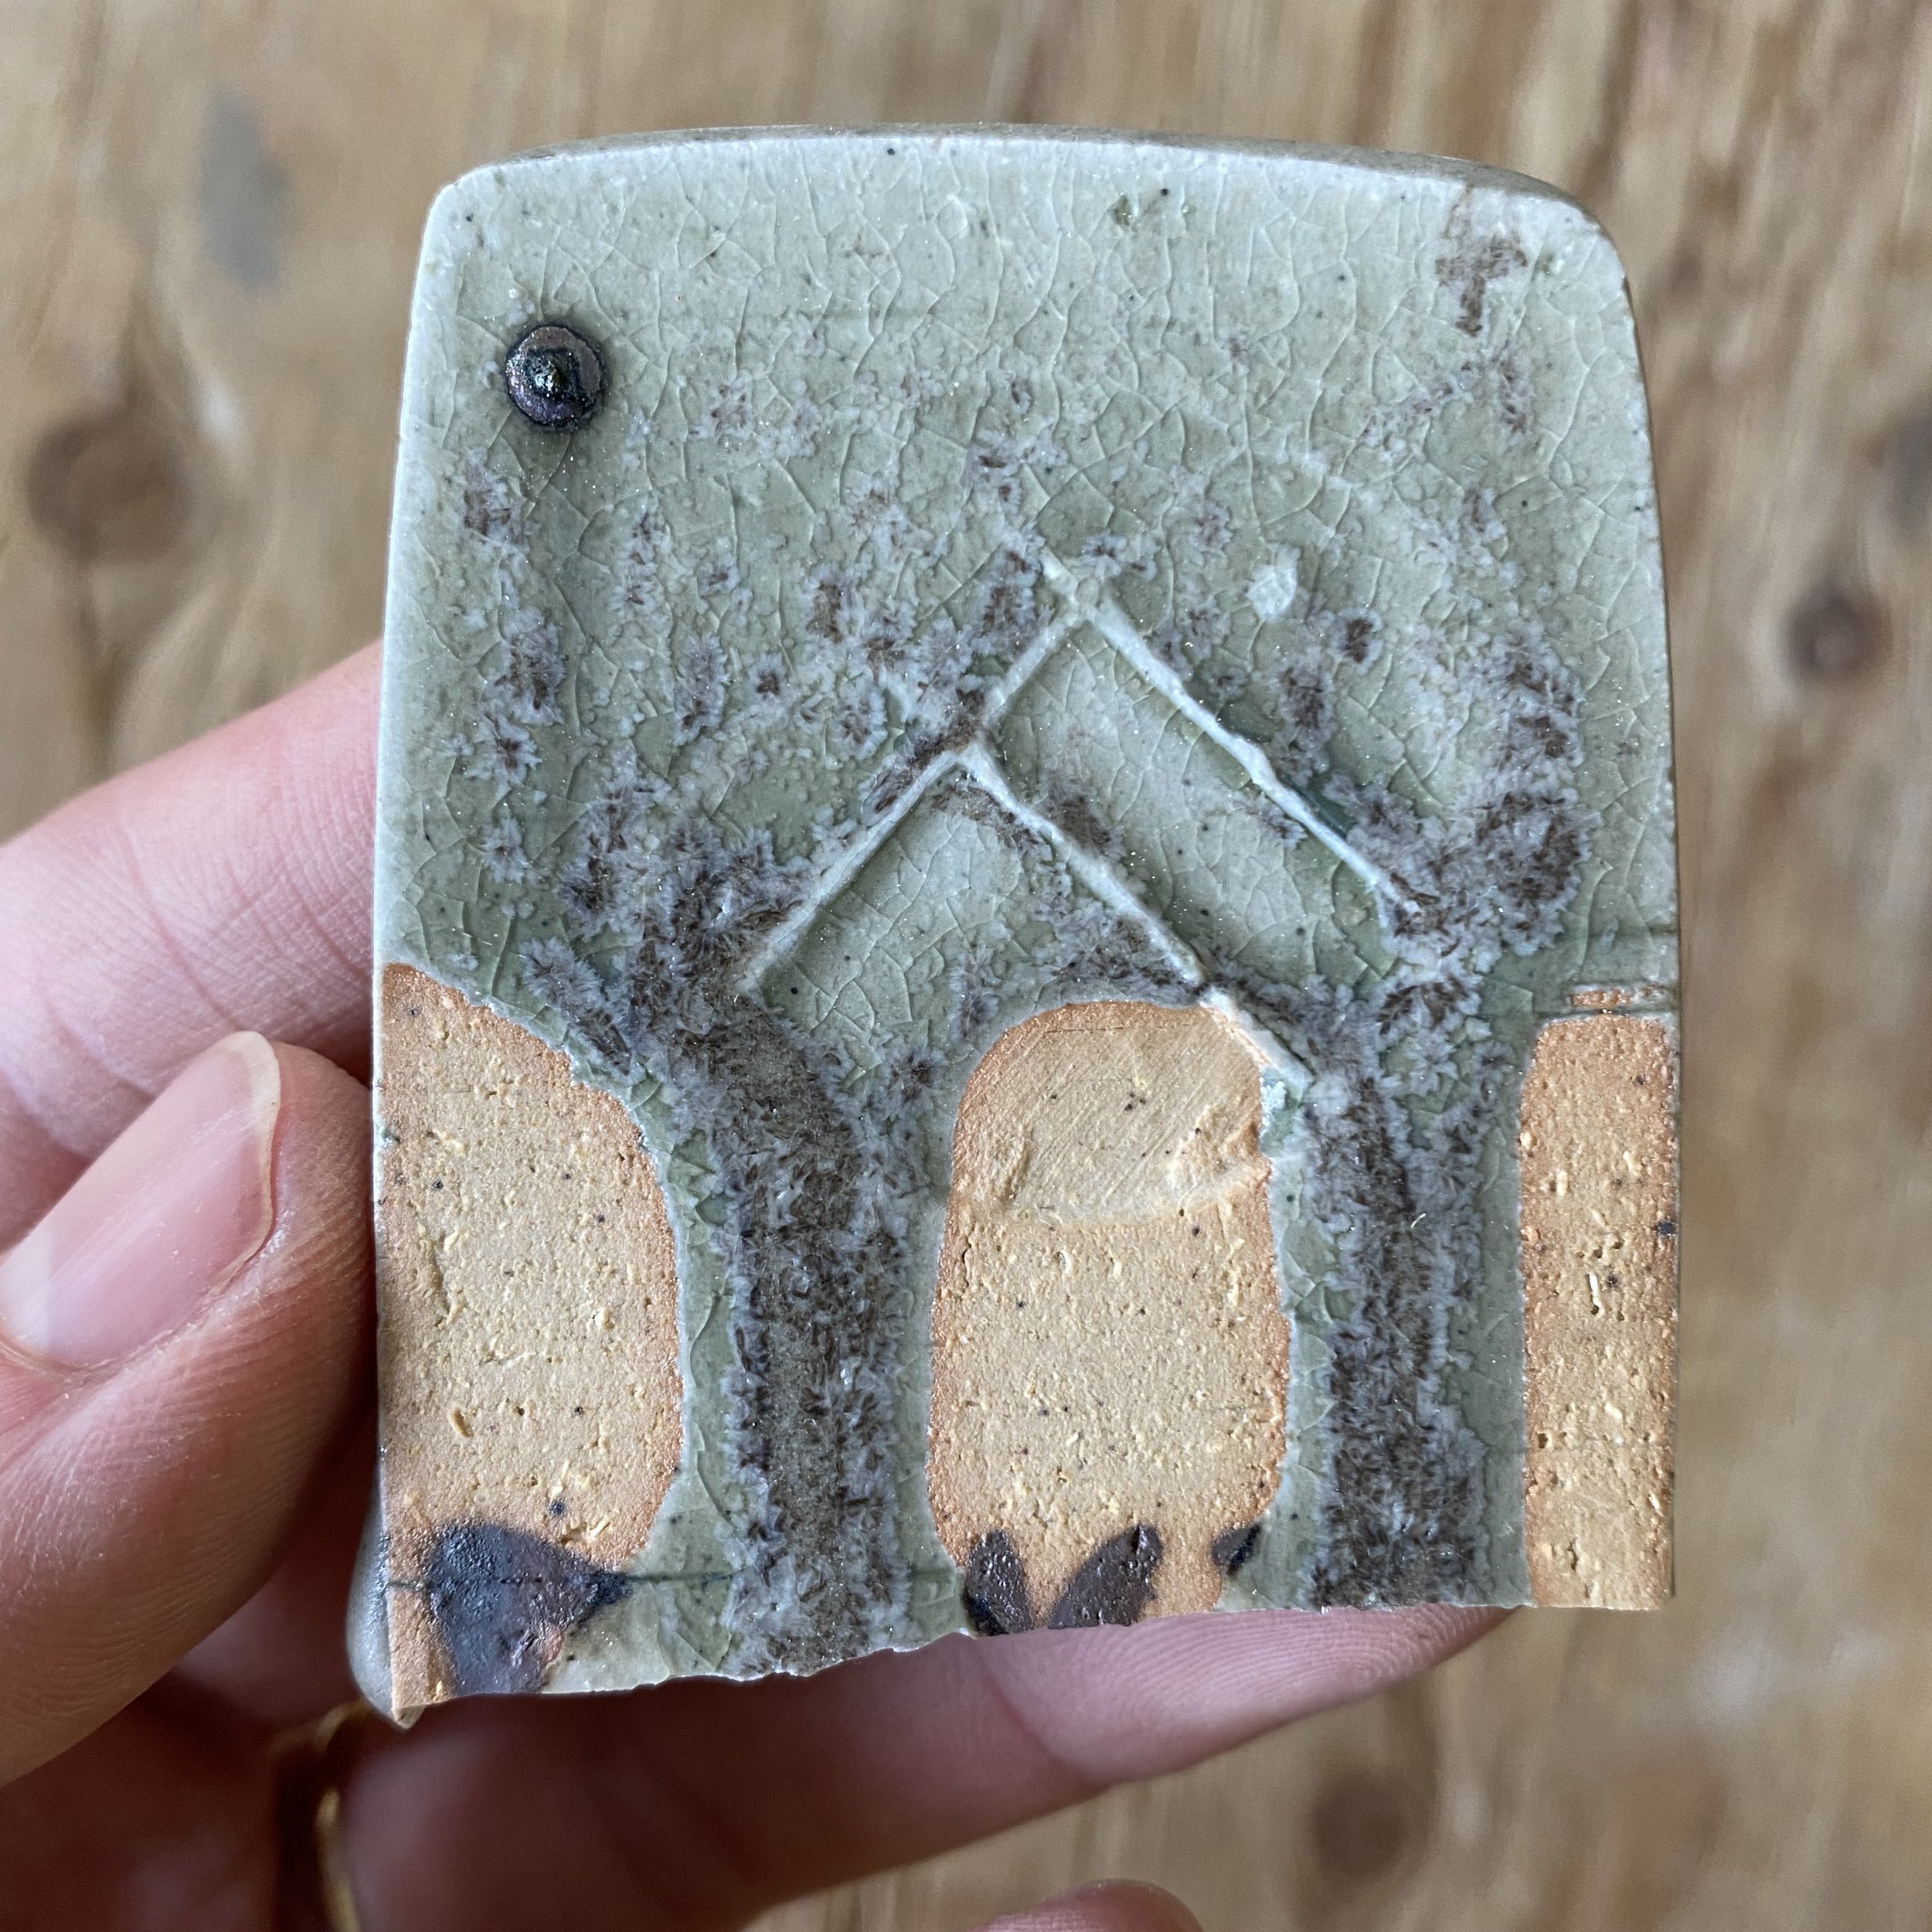
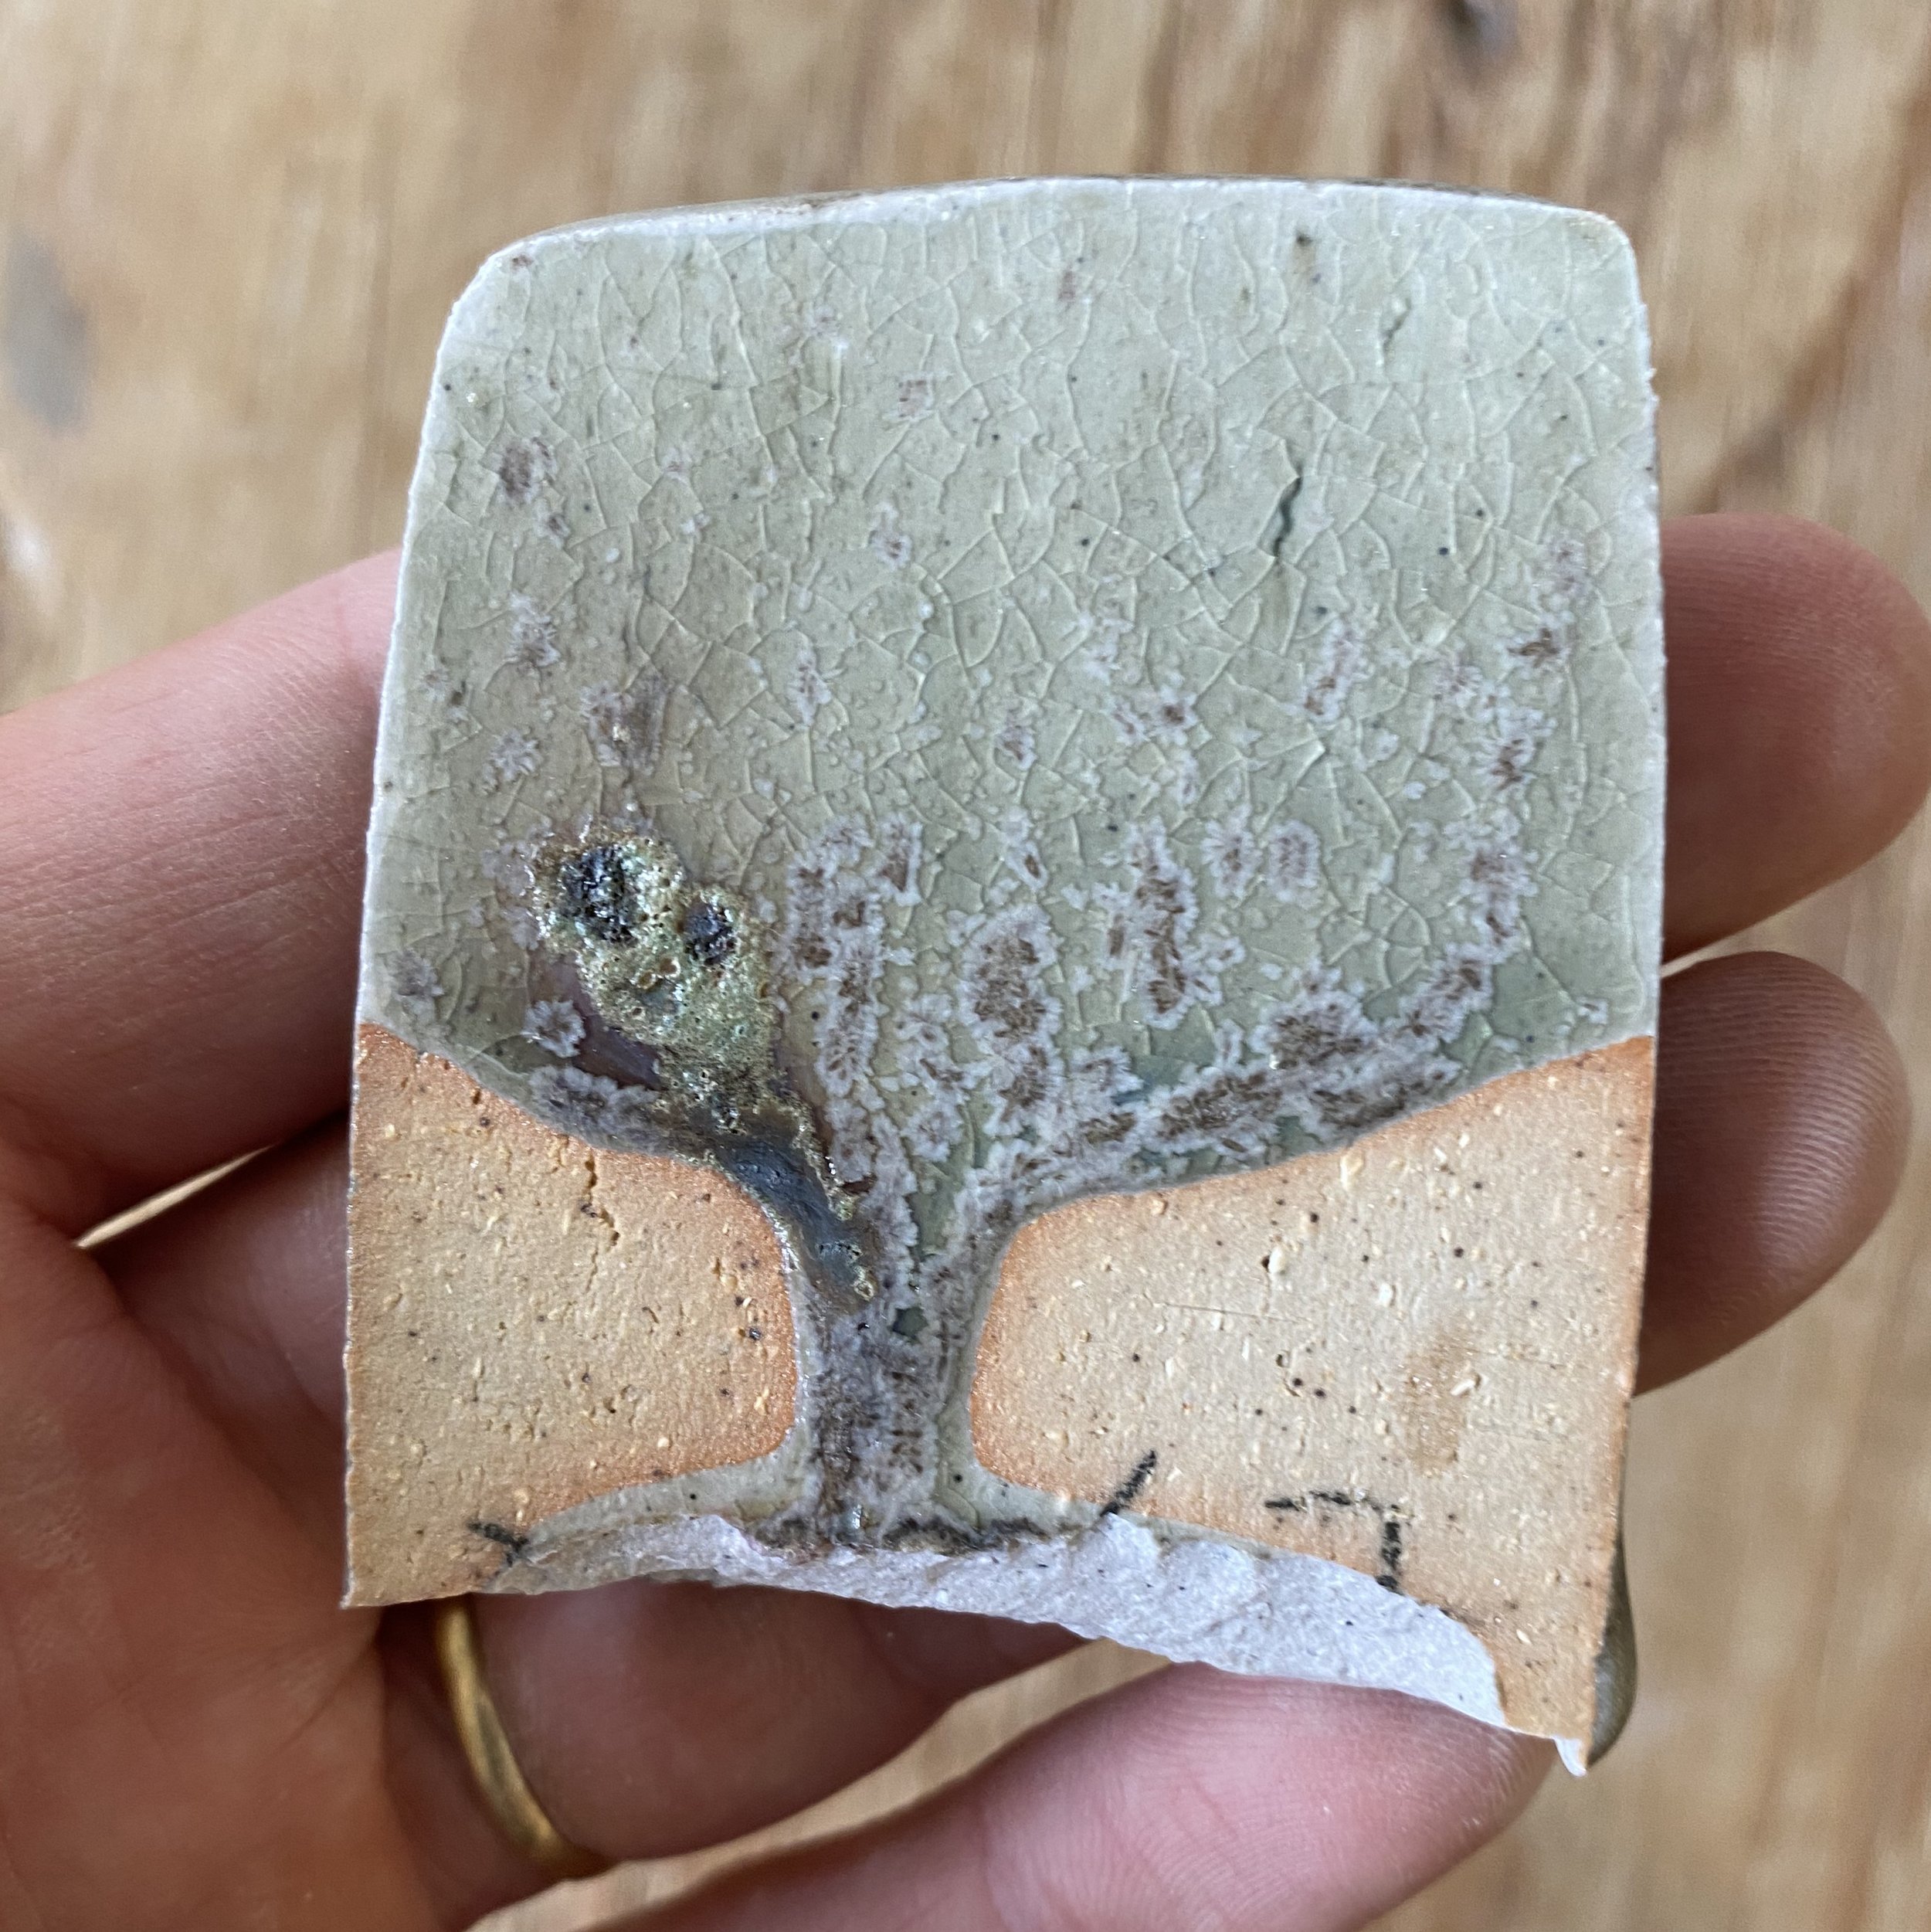
I also had a small test bowl glazed with DP1266 in the kiln which got properly reduced and came out nicely. Here it is…
The difference in the tile to this dish shows the overall inconsistencies of this test and the elusiveness of the Jun glaze!
This grid set of tests led me to the conclusion that I am in the right zone, but a lot depends on the firing. This was fired straight up in what I thought was a medium-reducing atmosphere. The tiles show that it was not as reduced as I hoped, and the areas that weren’t did not develop the Jun opalescence.
I would also note that in most of these tests, the copper did not show up as easily as some of my previous tests. I am thinking of trying to apply the copper over the glaze to see if that works, and also trying to mix the copper into some of the glaze. But it might be a case where having less silica helps the copper come through.
Next firing, I will try to do a slow cooling and keep the kiln in a heavier state of reduction.
These results are very encouraging, though. Especially this little dish at the end.
Jun (Chün) glaze tests: grid test 2
After my first grid test, I saw that I was on the right track. The glazes around corner A of my grid test were particularly promising. This was the composition of Corner A…
Corner A = DP1180 (S:Al 15.11, R2O:RO 0.2:0.8)
50% DP granite
20% Silica
20% Wollastonite
7% Mahavir (potash feldspar)
3% Dolomite
+2% Bentonite
+2% Bone Ash
+1.5% RIO
For my next grid test, I decided to try to put this glaze in the center of my next grid, and move in various directions around it. Here is the breakdown of the grid…
Here is the percent analysis of each corner of this grid test:
Corner A = DP 1214 : High Silica Corner
43% DP granite
30% Silica
20% Wollastonite
5% Mahavir (potash feldspar)
2% Dolomite
+2% Bentonite
+2% Bone Ash
+1.5% RIO
Corner B = DP 1218 : High Potassium Corner
45% DP granite
14% Silica
14% Wollastonite
25% Mahavir (potash feldspar)
2% Dolomite
+2% Bentonite
+2% Bone Ash
+1.5% RIO
Corner C = DP 1244 : High Wollastonite (calcia) Corner
45% DP granite
30% Wollastonite
18% Silica
5% Mahavir (potash feldspar)
2% Dolomite
+2% Bentonite
+2% Bone Ash
+1.5% RIO
Corner D = DP 1248 : High Devil’s Playground Granite Corner
70% DP granite
16% Silica
14% Wollastonite
2% Dolomite
+2% Bentonite
+2% Bone Ash
+1.5% RIO
Lets see what happened…
On first inspection I was kind of surprised at how linear this test seemed. The successful glazes all seem in the middle row and the one to its left, running down the grid. The left side row is obviously dry, with too much silica, and the right is more like a standard celadon.
It is hard to tell too much more from this grid test, though. I think part of the issue is that these grids are so small and are fired lying down. The vertical test tiles show us much more information.
One note about these tests is that I mixed the corner glazes a bit thin. I wish the application had been thicker on these tiles. The results would have been better and easier to read. Next time!
Let’s dig in to the results. First from corner A to corner B. This is from our high silica corner to our high potassium corner…
As we might expect, corner A is pretty dry, with too much silica. As we move towards C the glaze becomes more fluxed but not particularly Jun like.
Now lets examine corner A to corner C (click on the images to enlarge them)…
In these tests we move from the high silica corner at A, to the high wollastonite (calcia) corner at C. I would have expected a decent glaze in the middle of these. There is a hint of a Jun at DP1224 but it is quite pale.
Now corner C (high calcia corner) to D (high granite corner)…
Here we find DP 1245 and DP 1246 to be Jun like. The color is a bit dull but the Jun opalescent effect is present.
Now let’s examine corner B (high potassium corner) to D (high granite corner)…
In this run we see the glaze get darker towards corner D, but largely remain as a celadon glaze. No signs of Jun opalescence along this row.
Now I will lay out the middle of the grid. Front of the tiles first and then the backs below.
Most of these glazes show signs of Jun opalescence. Most promising seem to be in the center of the grid, as I expected. DP1231 is composed of 50.75% DP granite, 19.5% silica, 19.5% wollastonite, 8.75% mahavir feldspar, 1.5% dolomite, 2% bone ash, 1.5% red iron oxide.
There were promising glazes around this, but in general the left side of the center was more promising than the right. This is the higher silica zone.
After this test, I could have picked one of these to work with and glaze some pots, but I wanted to hone in more tightly, to see if I could find a magic ratio of ingredients. One more grid test and I should have it!
Oh also, I should mention that these were fired to cone 10 (I could have taken it a bit further so cone 10 touched down but this is acceptable) with no special cooling. Here is the cone pack, and my notebook notes just to be thorough about it:
Jun (Chün) glaze tests: grid test 1
I knew before starting this endeavor that Jun glazes are notoriously tricky to achieve, but that has never stopped me before! In my initial set of Jun glaze tests I aimed at 12 likely glaze formulations using my local granite, based on glaze analysis and formulations by others. See my last post for more details.
The initial Jun glaze tests were not entirely successful. You never expect to hit the nail on the head first go but when I opened the kiln at first I was disappointed to see what appeared to be 12 celadons. But on closer inspection there were hints of Jun effects where the glaze pooled and was super thick. I was encouraged but also knew I needed to shift my tests significantly.
I went back to the literature and did a lot more reading about Jun glazes. See my last post for the research I did. It is a fairly deep dive into the science of how Jun glazes work.
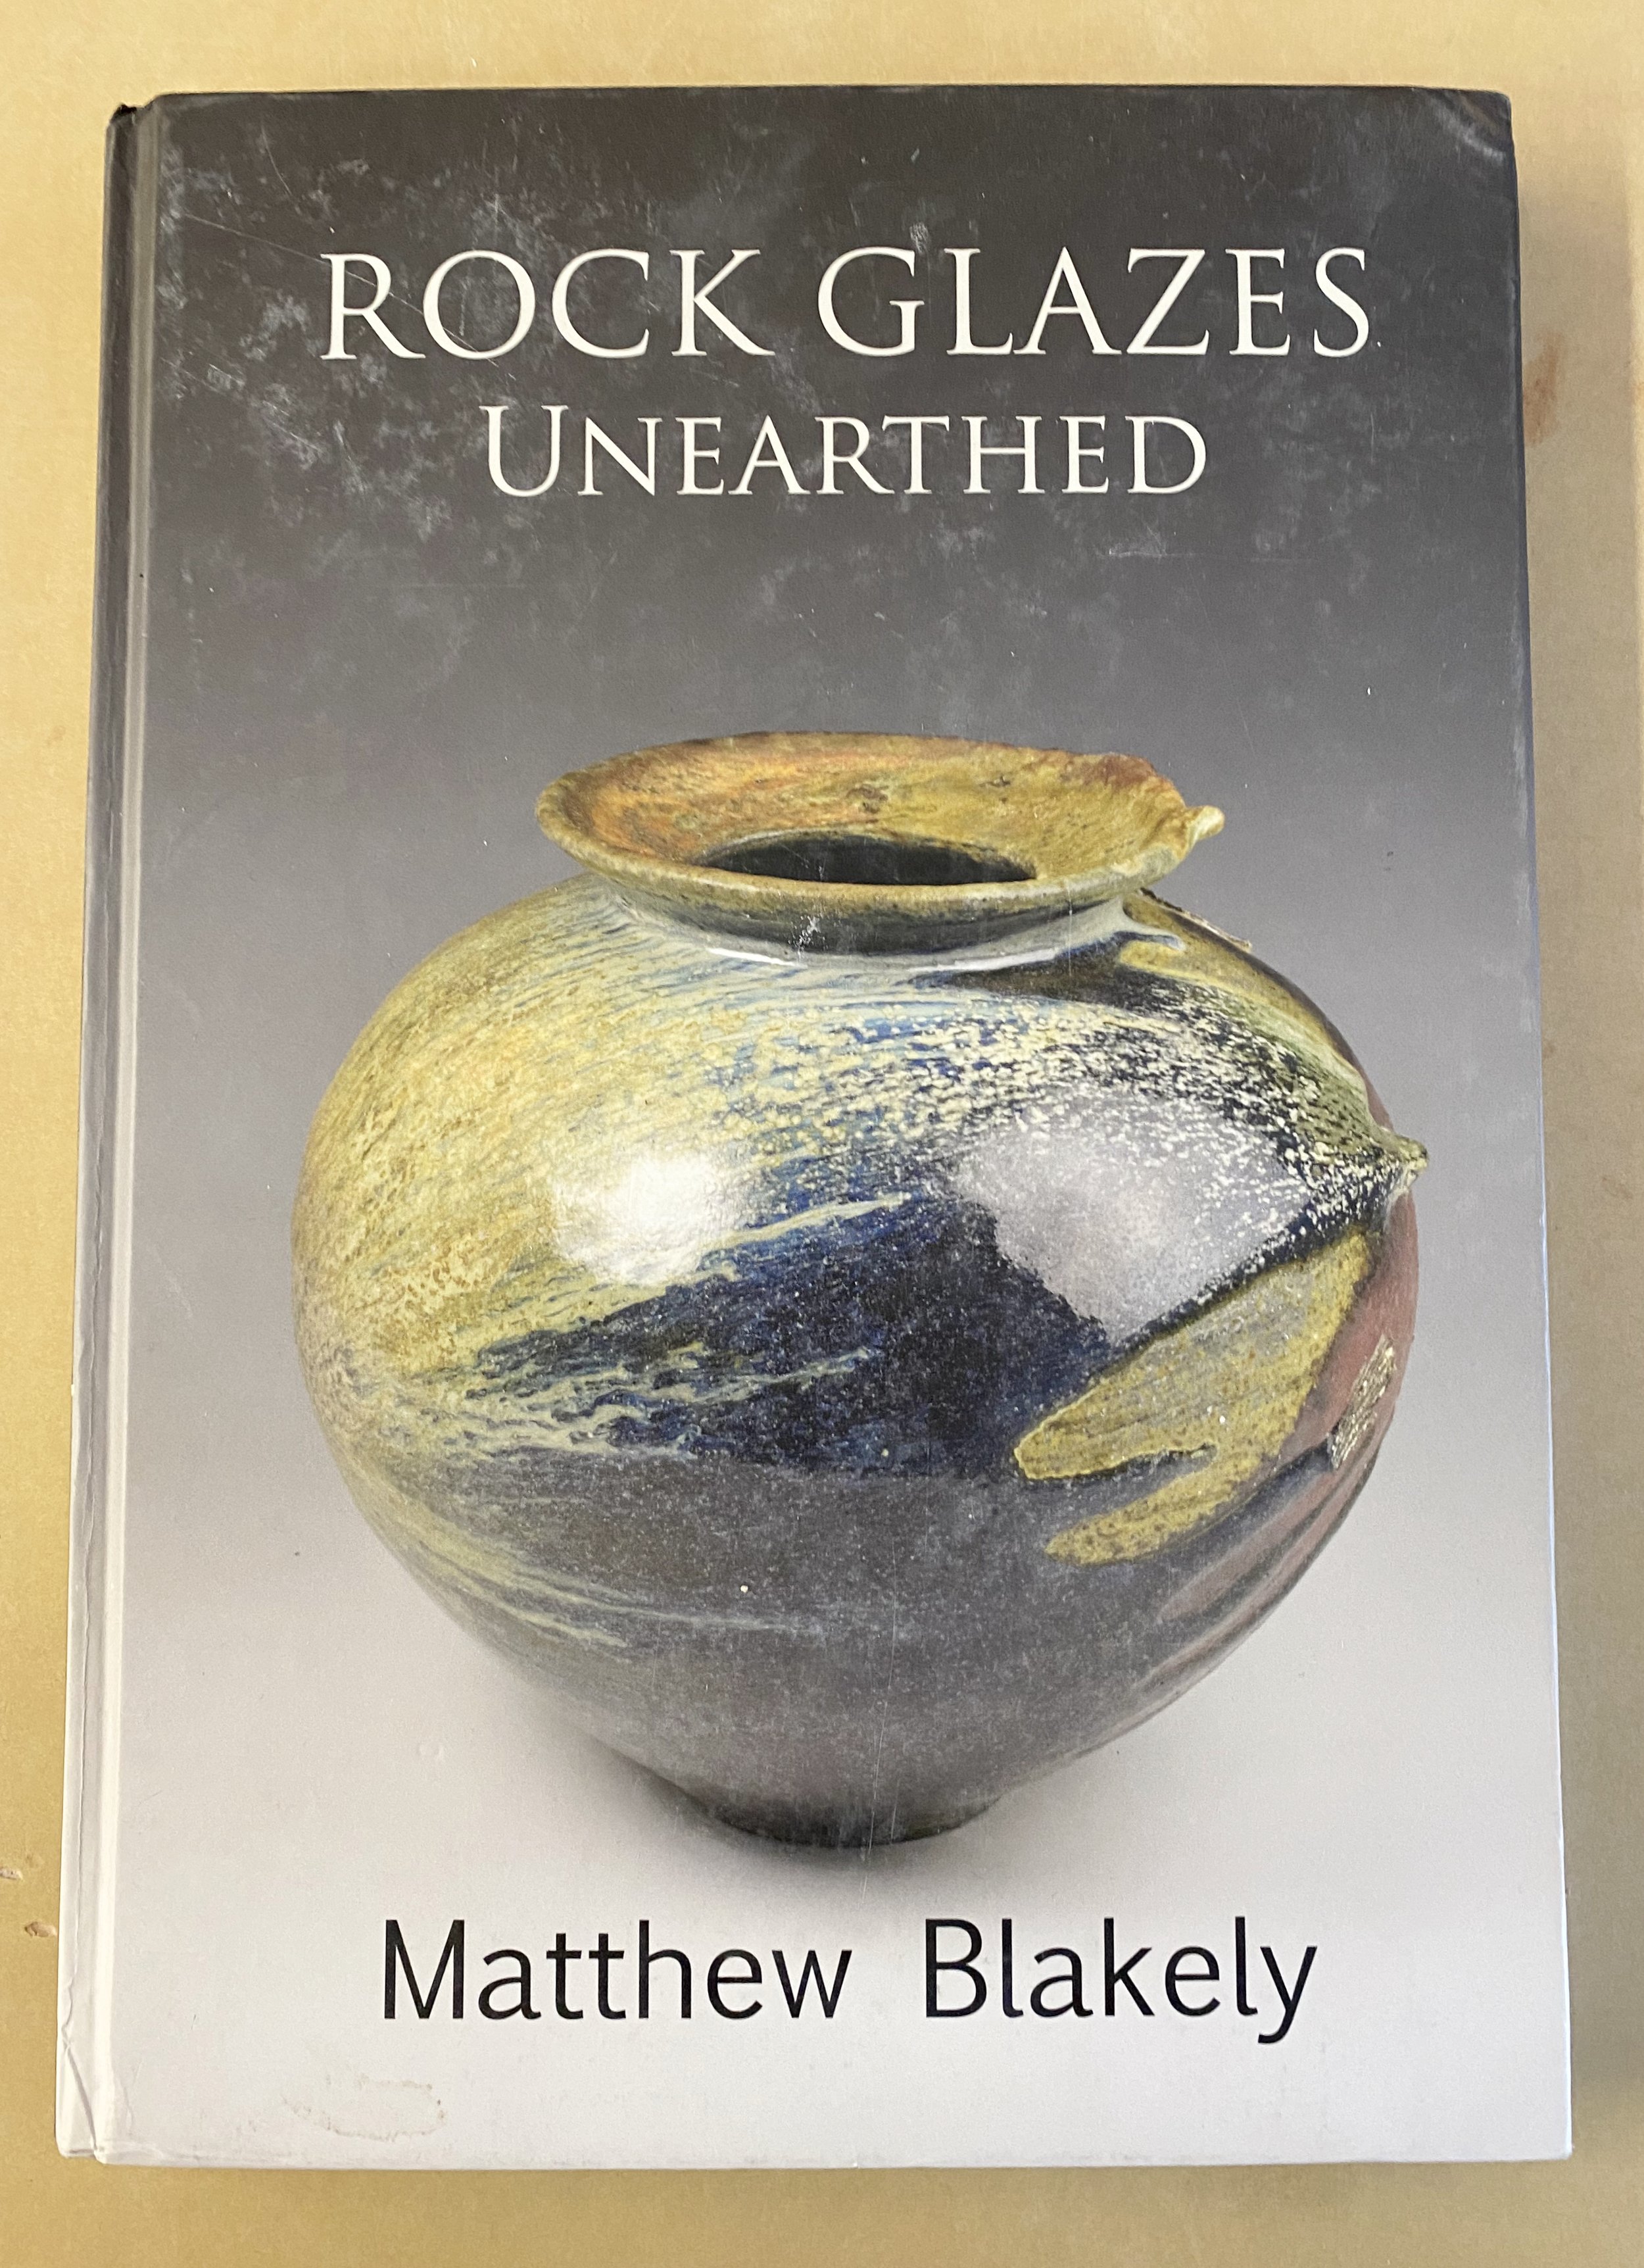
Matt Blakely’s new book, Rock Glazes Unearthed was particularly helpful, giving practical advice for those looking to make Jun glazes with collected materials. He said that even though many Jun recipes have an alumina:silica ratio of 1:12 it may be necessary to push this higher when using granite as a base material.
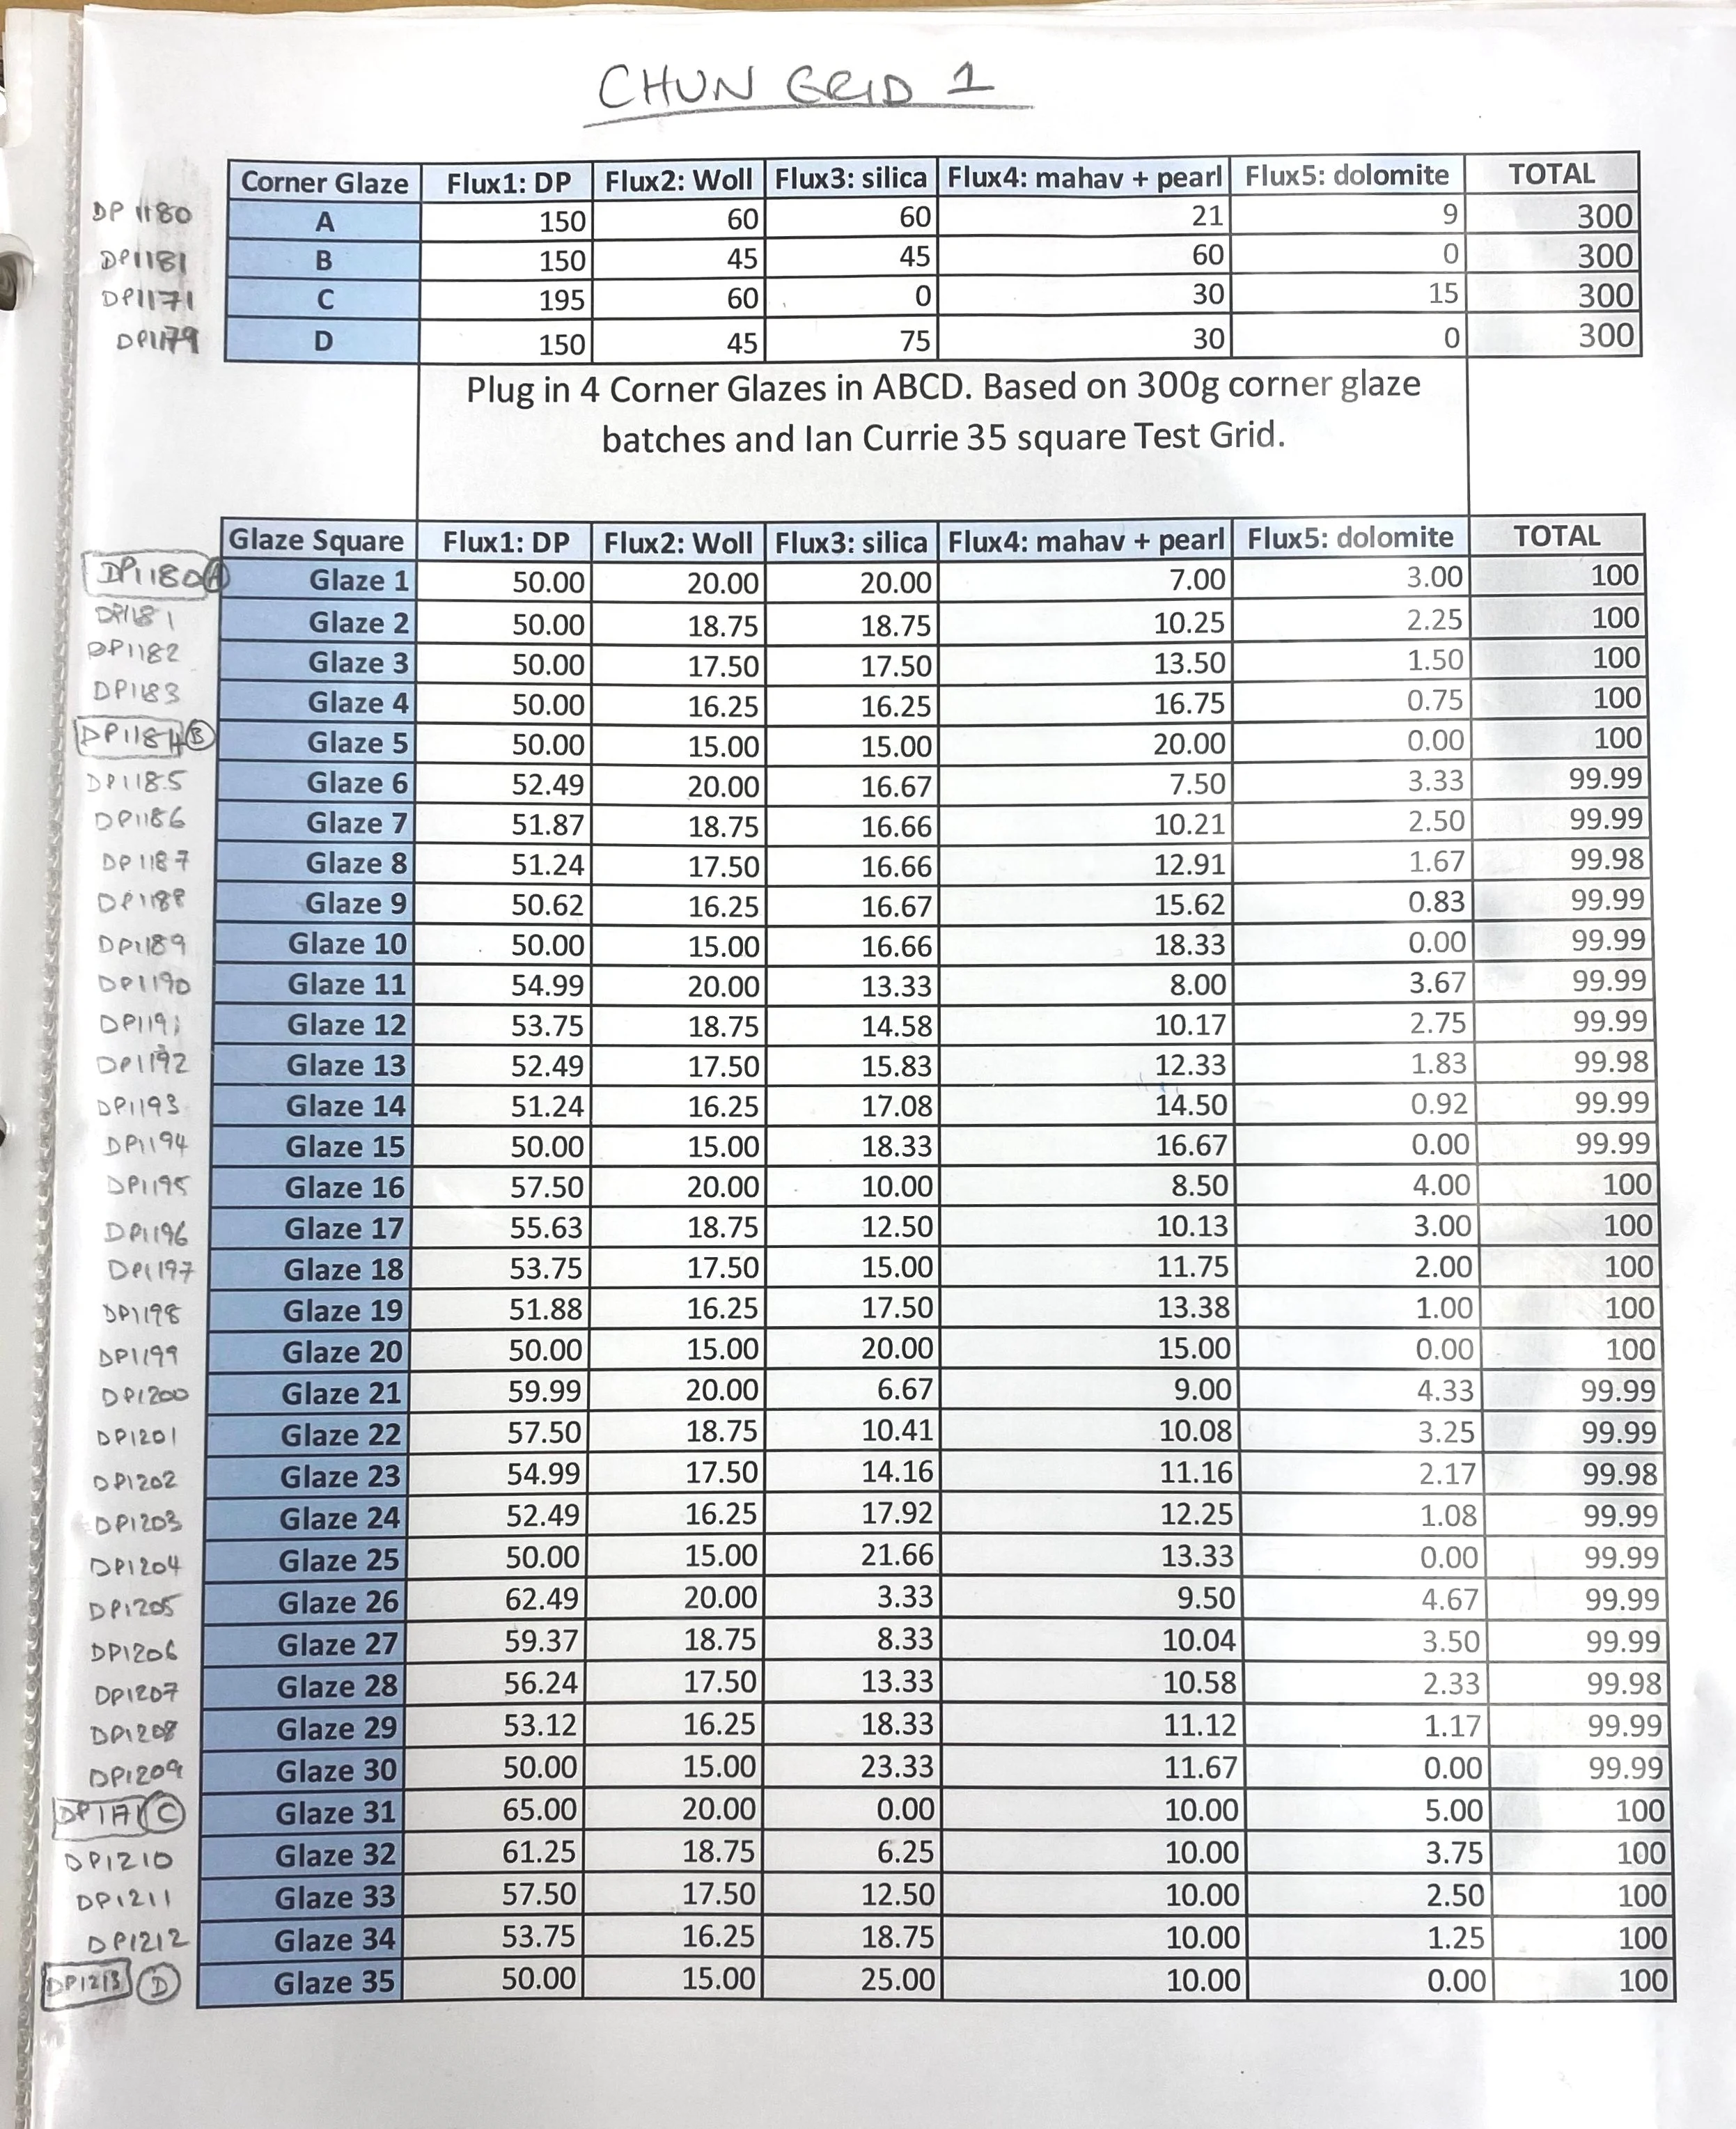
Getting down to business. This shows the tiles and cups laid out ready and the recipes for each of the corner glazes. Slightly confusingly I chose to use one of my previous glaze attempts DP1171 as Corner C. Just to make you aware of that. The other numbers continue increasing in a normal fashion-this is the only odd one out.
I measured out 500 grams of each corner glaze in materials, and then topped them up to 650ml. Each individual test gets 35ml so these measurements ensured I had a bit extra in each corner left over (in case things go wrong).
Corner A = DP1180 (high silica, high calcia corner) S:Al 15.11, R2O:RO 0.2:0.8
50% DP granite
20% Silica
20% Wollastonite
7% Mahavir (potash feldspar)
3% Dolomite
+2% Bentonite
+2% Bone Ash
+1.5% RIO
Corner B = DP 1184 (high potassium corner) S:Al 12.55, R2O:RO 0.4:0.6
50% DP granite
15% Silica
15% Wollastonite
15% Mahavir (potash feldspar)
5% Pearl Ash
+2% Bentonite
+2% Bone Ash
+1.5% RIO
Corner C = DP1170 (lower silica to flux corner, high Mg) S:Al 11.11, R2O:RO 0.21:0.78
65% DP granite
20% Wollastonite
10% Mahavir (potash feldspar)
5% Dolomite
+2% Bentonite
+2% Bone Ash
+1.5% RIO
Corner D = DP1213 (high silica corner, no Mg) S:Al 15.07, R2O:RO 0.29:0.71
50% DP granite
25% Silica
15% Wollastonite
10% Mahavir (potash feldspar)
+2% Bentonite
+2% Bone Ash
+1.5% RIO
{Side note: One issue I found in coming up with my first set of glazes, based on chun cherd analysis from Nigel Wood’s book, was getting a high enough potassium content. My Devil’s Playground granite has some but not as much as needed. I therefore decided to use pearl ash in some recipes. You can see I use it in Corner B here. However… John Neely, my Professor here at Utah State University, told me that Pearl Ash is not a good source of potassium because it is soluble. This means it will move into the clay body, or onto the surface of the glaze… it doesn’t mix in to the glaze like other insoluble glaze materials}
Here is the test grid fresh out of its cone 10 reduction firing…
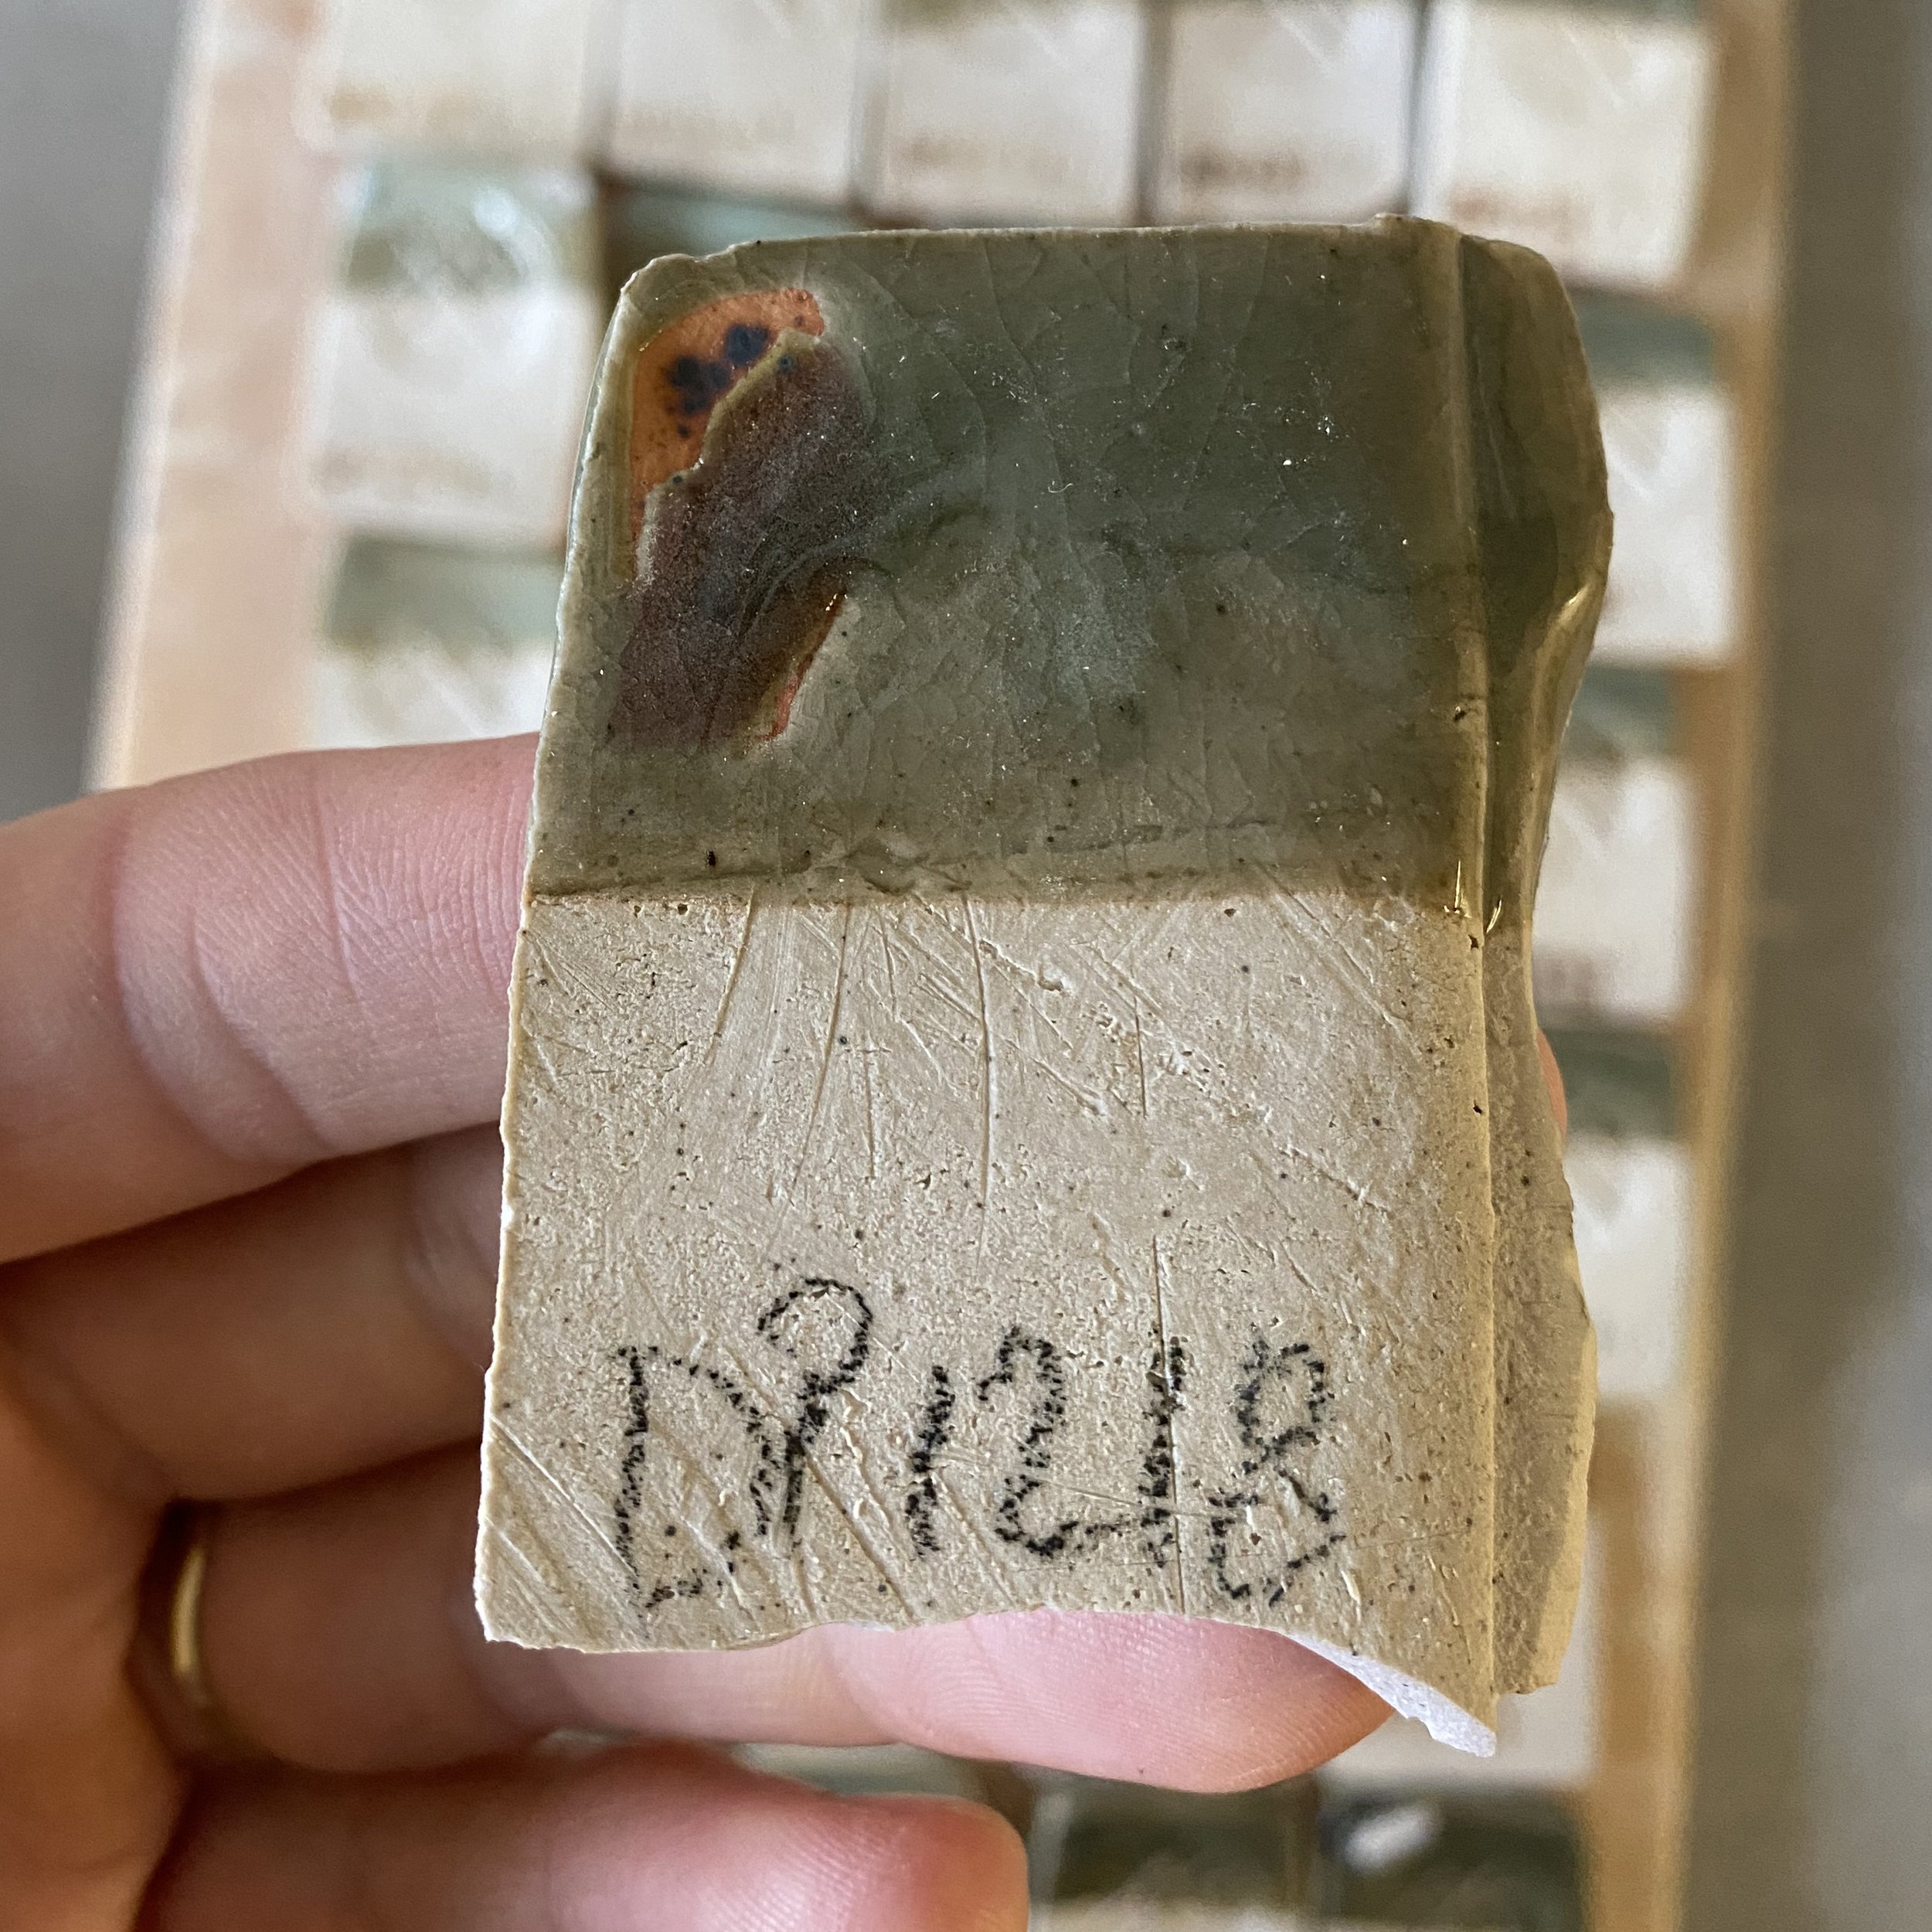
DP1180-1213
When I got this out of the kiln (still rather toasty) I was thrilled. There looked to be so many successful chun glazes. This grid test is a little deceptive though, simply due to its nature. Each of these grids has a thick layer button of glaze on it (thicker than you would normally glaze a pot, and as the grid is fired flat the glazes can’t really run anywhere. I know from my research that chun effects occur where thick and pooled, so its no surprise that they look so good.
However, I also dipped individual test tiles for each of the grid squares. These were fired vertically so the glaze had a chance to run if it wanted. I double dipped them so the top of each tile had a double thick layer of glaze. You can see them in the backdrop of this photo and then below.
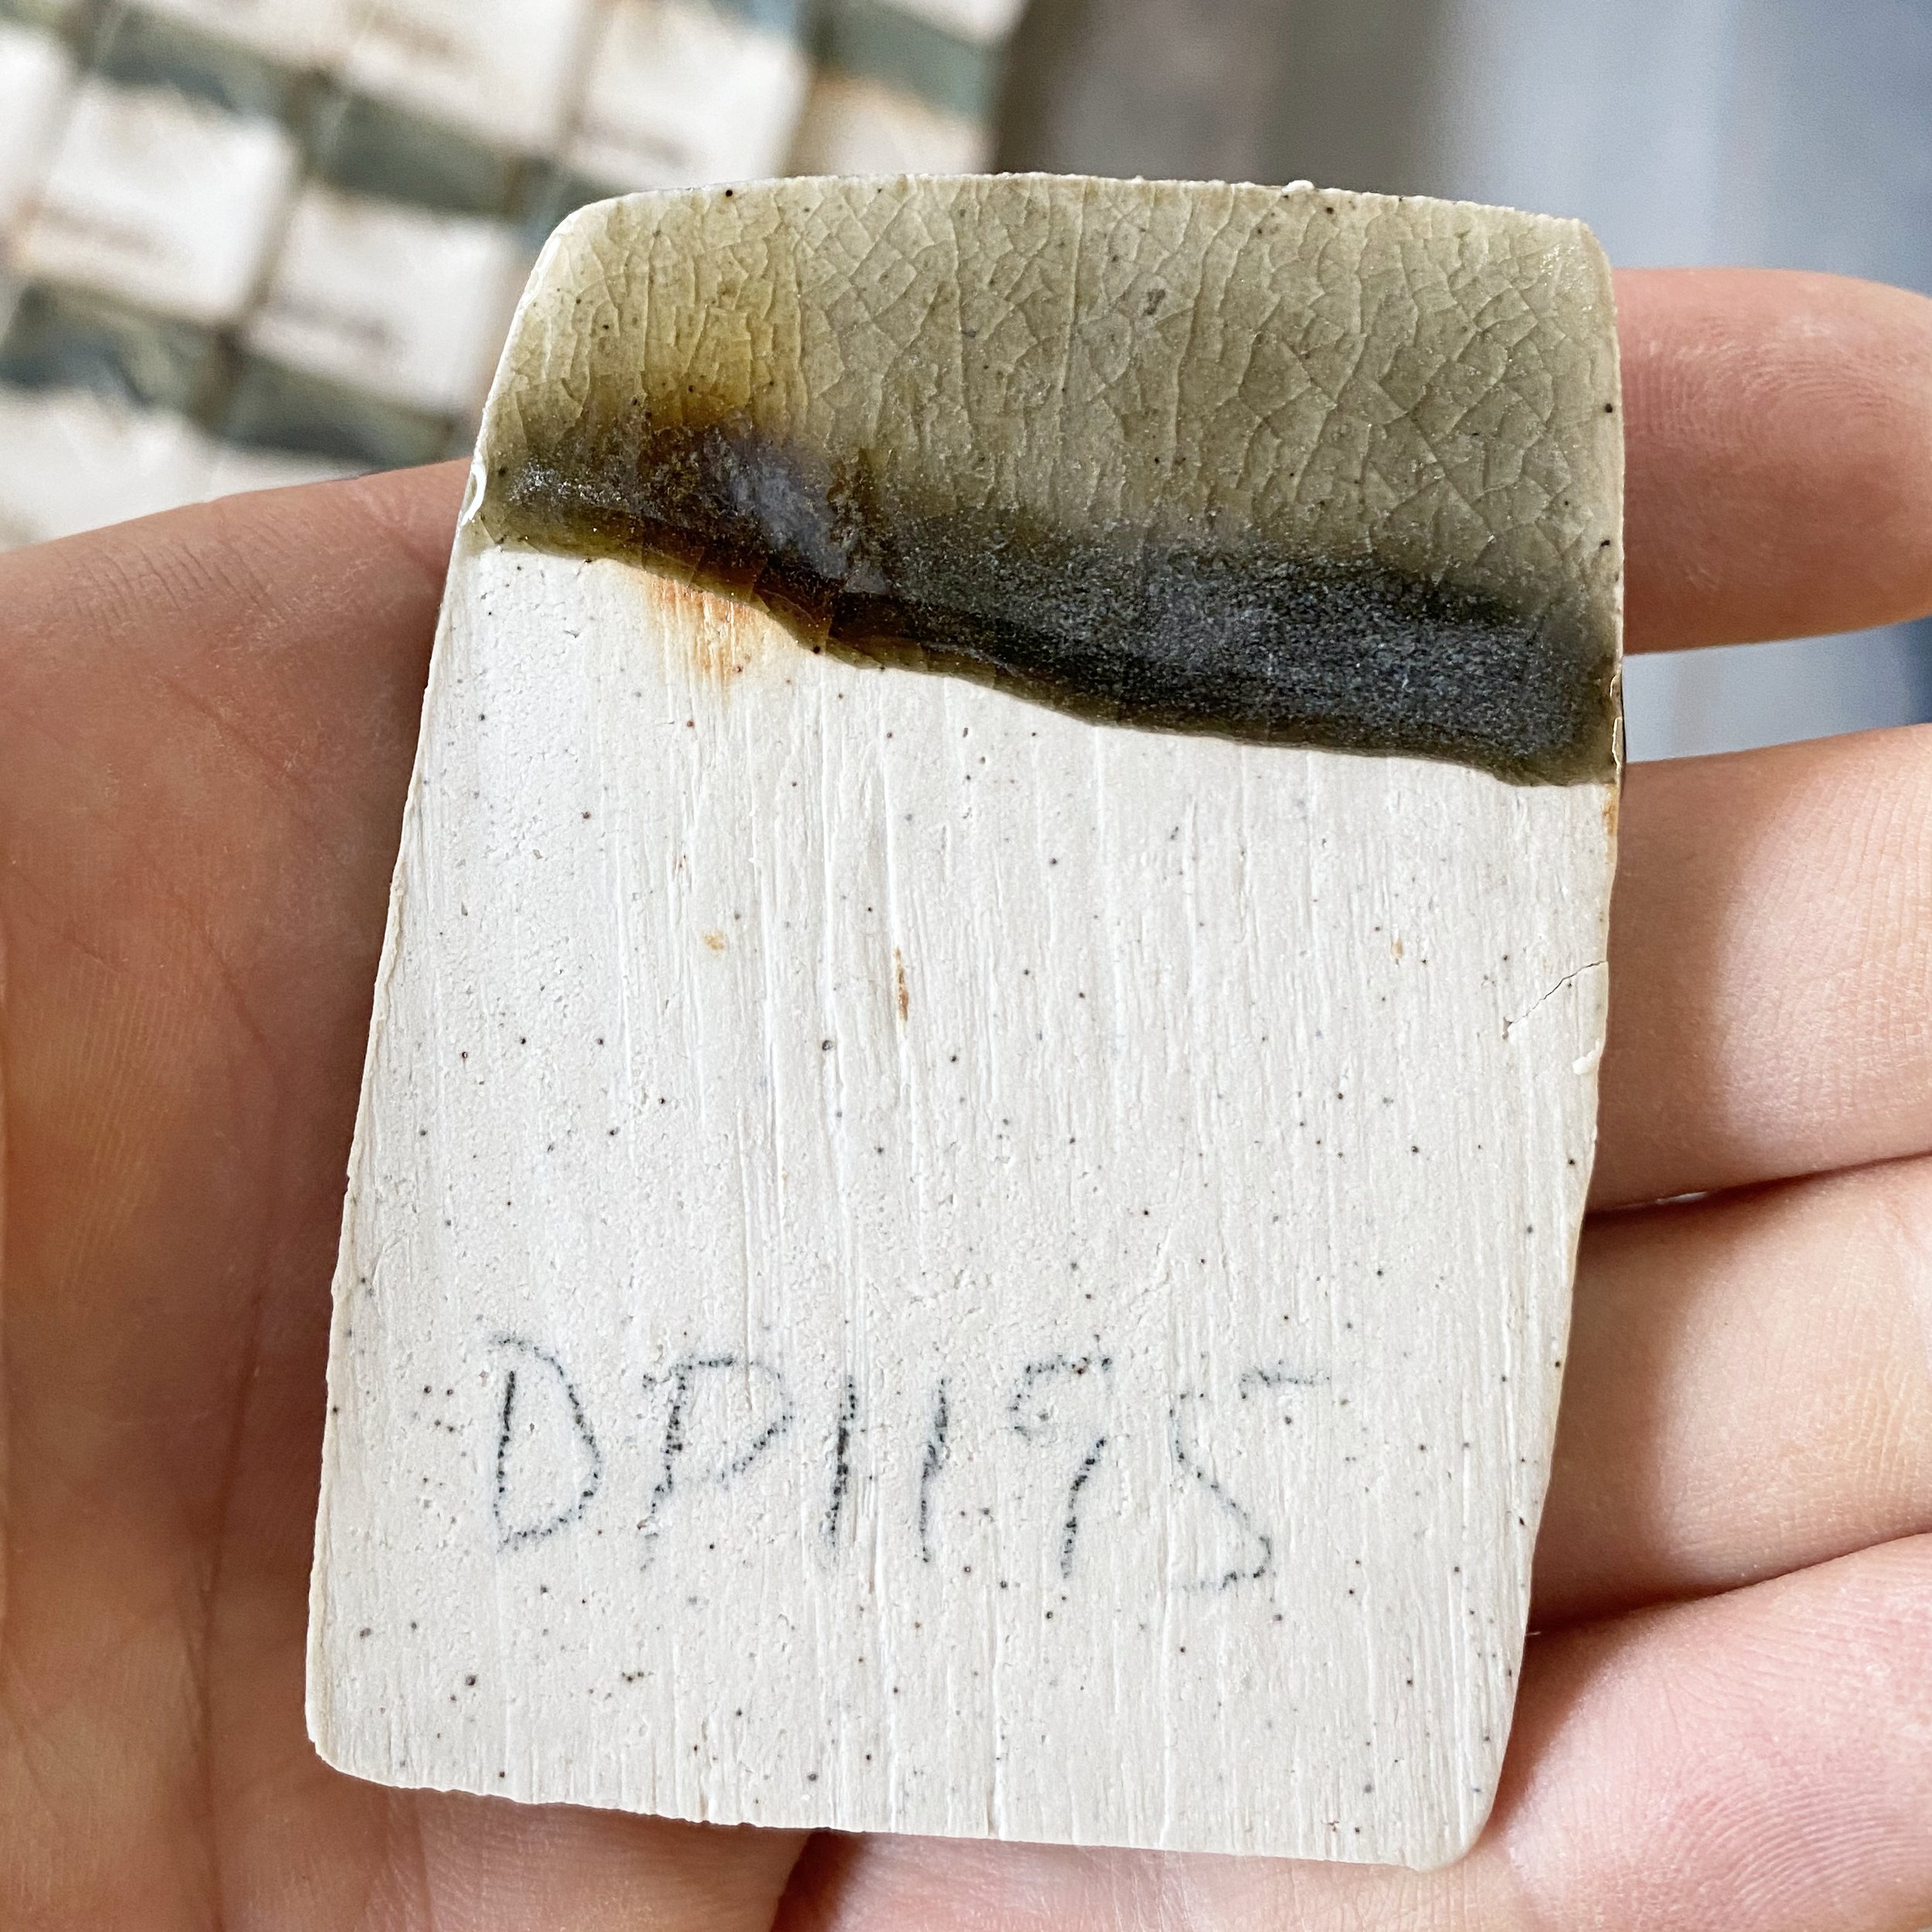
I got much more information from these vertical test tiles. You can click on them to enlarge the image. You can see how much more variation in the glaze grid there are. Not all of the glazes that looked good on the flat grid test came out so well on these test tiles.
By the way, these were all fired to cone 10 in a small test gas kiln. I did a heavy body reduction for an hour and then kept the kiln in reduction to top temp of cone 10 (lessening the reduction as the firing went along to gain temp). No hold at the top and no intentional cooling; ie. they cooled very fast.
On the backside of each test tile I painted a strip of copper carbonate to see its response under the Jun glaze. It was exciting to see some of the colour responses.
The top left of the grid is clearly the most successful (closest to a chun):
Although these two glazes were in the zone too…
Now let’s look into the tests a little more closely (click on any of the images to zoom in).
Moving across the top row of the grid from Corner A to Corner B the glaze gets less chun like. Dp1180 is lighter than 1181 and 1182 but they all exhibit chun effects. DP 1183 and 1184 do not. In terms of the composition change we move towards more potassium and less silica here.
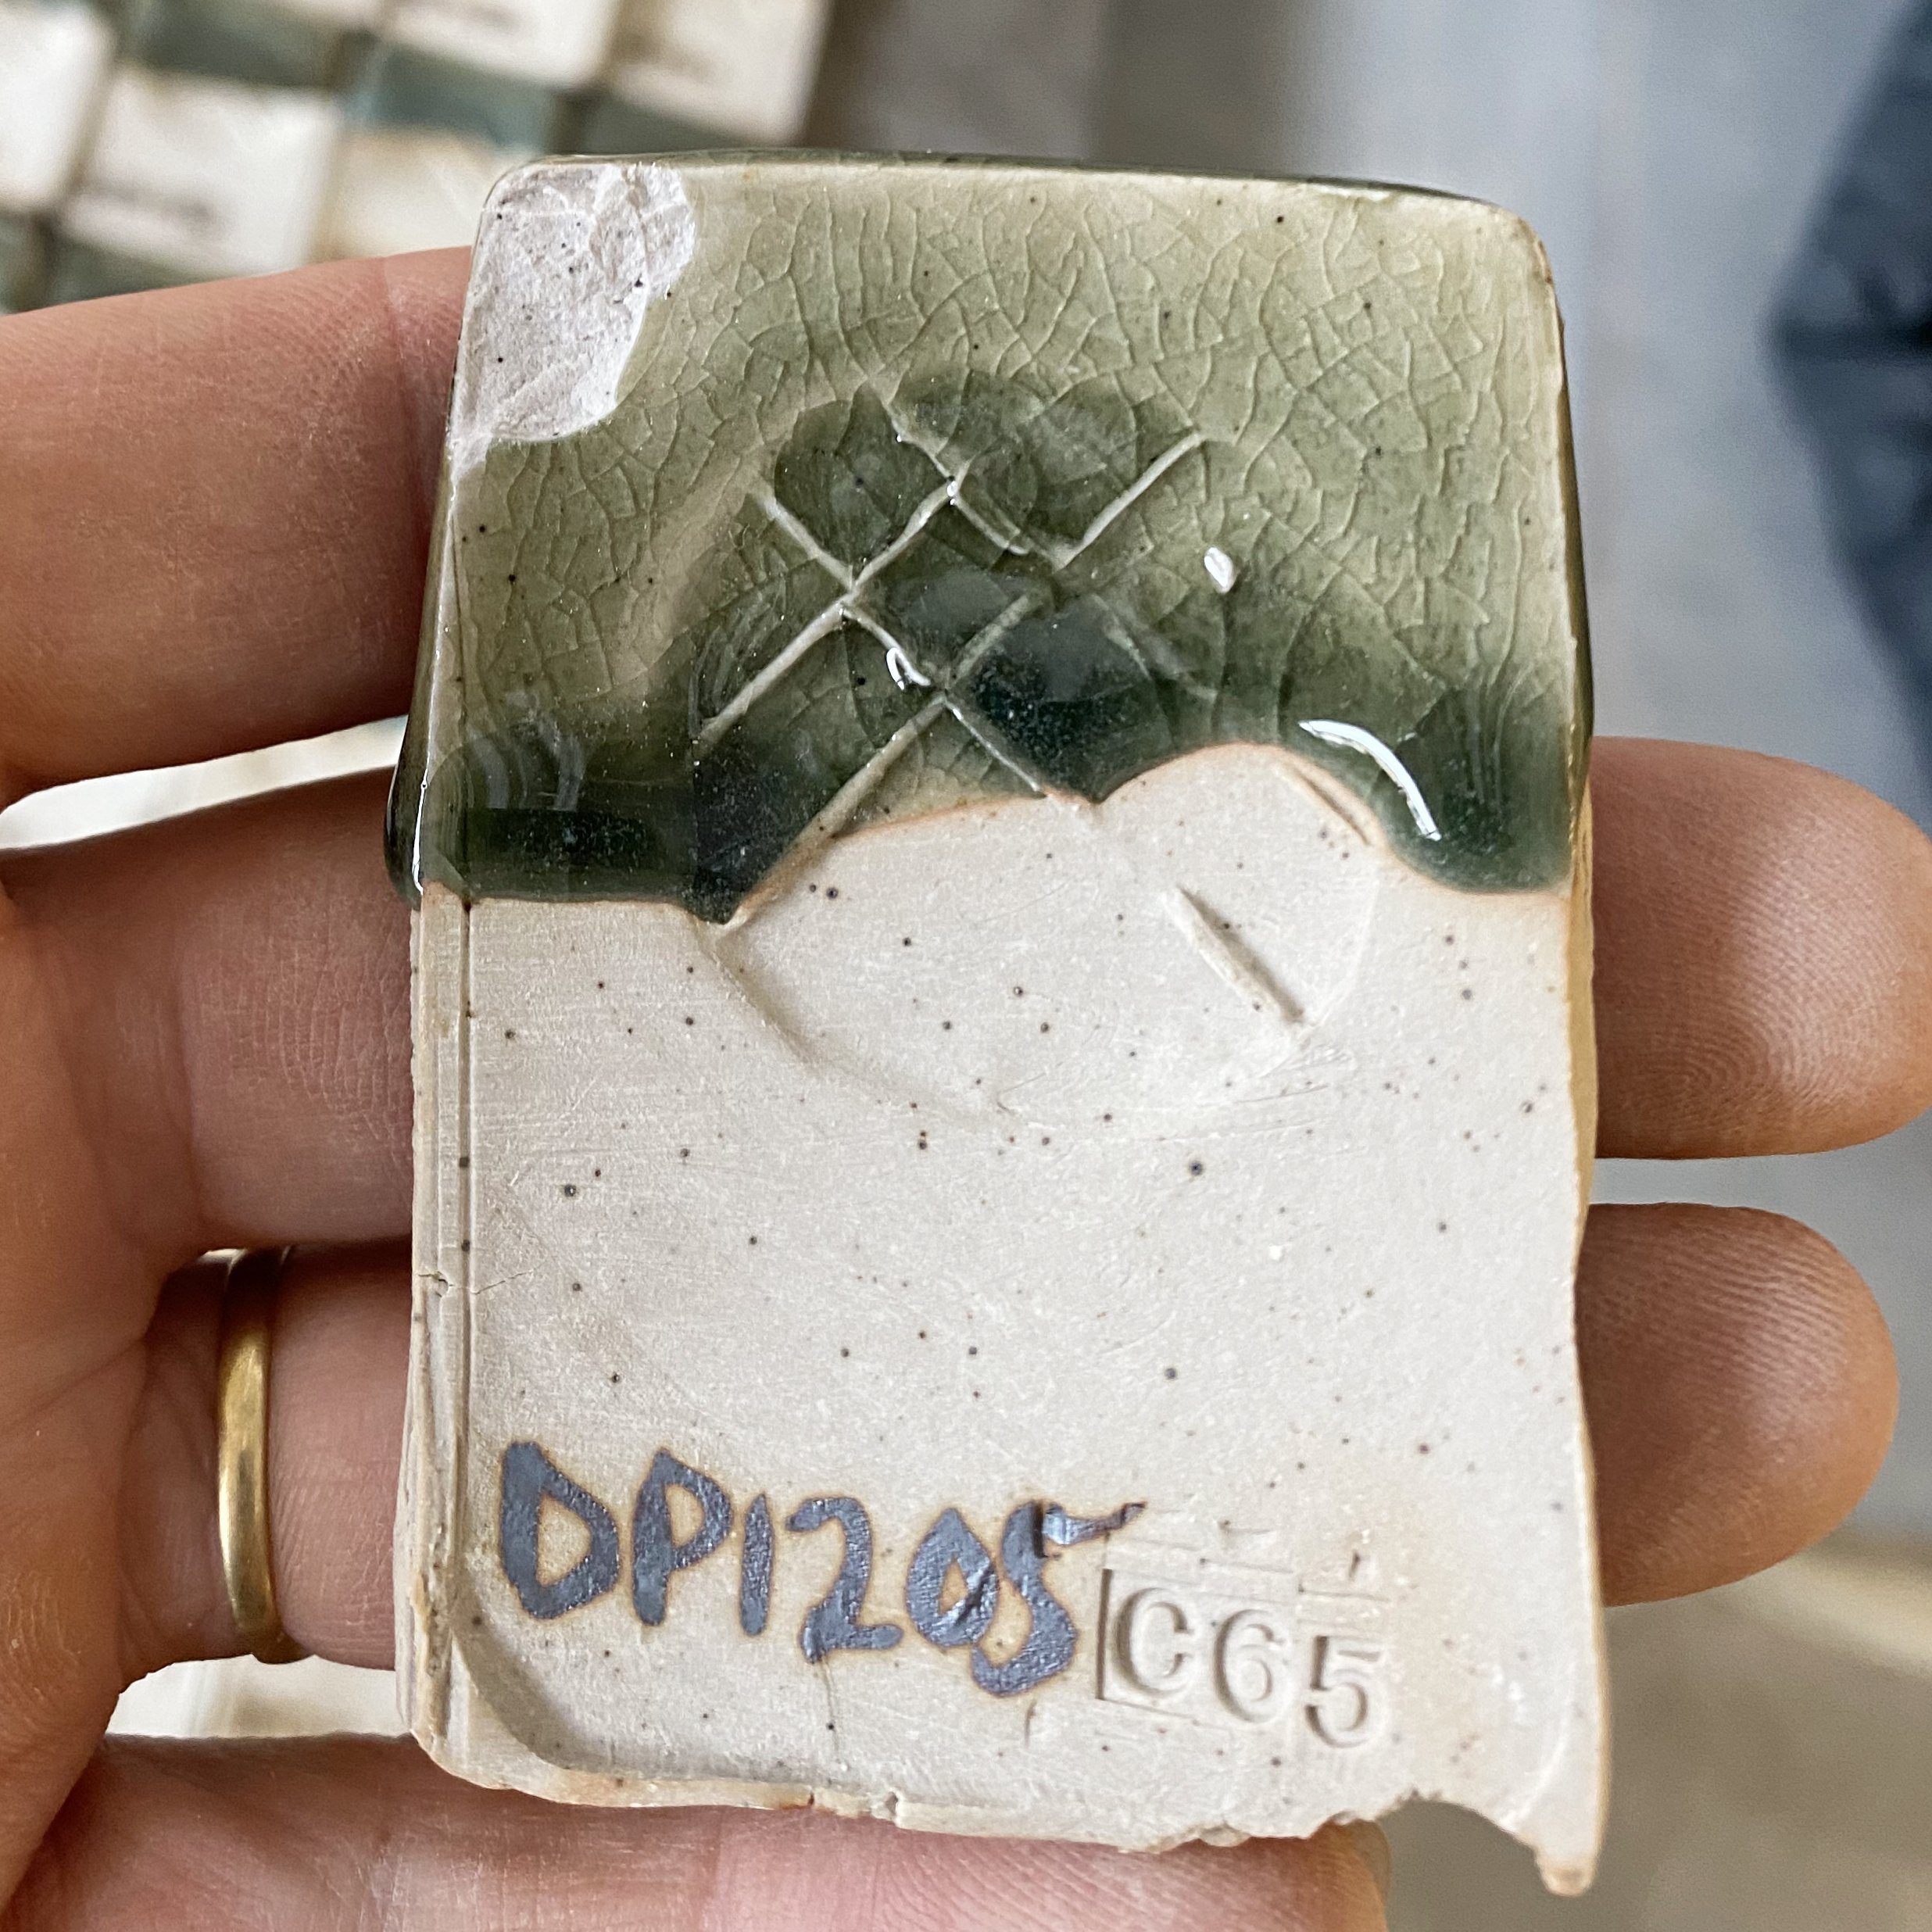
Moving from Corner A to Corner C the glazes get less chun like pretty quickly. Only DP1180 and DP1185 look promising. DP 1190 show some signs. DP 1205 is a full on celadon and looks like it wants to drip, no sign of chun features at all. In terms of composition this line blend moves to lower silica and higher magnesium. Frankly the composition change is not that vast which underlines the pointy that these chun glazes work in a very narrow sliver of glaze composition.
Here is the blend from Corner A-Corner C:
Now let’s look at Corner B to Corner D.
These are all kind of in the zone but not quite. The stand out in this row is DP 1204 (and its cousin next door at DP1203). What is special about DP1204? Lets look at its composition…
DP1204
50% DP granite
15% Wollastonite
21.66% silica
13.33% Mahavir (potash feldspar)
+ 2% Bentonite
+ 2% Bone Ash
+ 1.5% Red Iron Oxide
This is remarkably similar to the composition of the glazes in the top left of the grid that worked; DP1182 or DP1187 ish. This says to me I should do a new grid test where DP 1180 is in the center and I test around it.
Now lets examine Corner C to Corner D.
Neither of these corner glazes is particularly Jun like, interestingly DP1212 in the middle displays the most promise.
For the central area of the grid you can look and see what resulted. The second row up at the top was most promising: DP1186-8. But here are the middle tests laid out. I am trying to document thoroughly. Even the tests that I will not pursue. Click o an image to enlarge it.
Overall the zone in the top left of the grid, DP1180-2 and DP1185-86 were most promising. I will not pick one of these to move forward with at this stage, rather test more. But any of these could work I think. To my eye, if you held a gun to my head right now I would probably go with DP1186 (or DP1182, or DP1180. Don’t make me pick yet! Put the gun down!)
Here is the same grid test in cone 10 reduction compared to a more oxidised cone 11 firing. So different!
You can only really see the Jun effect in the top left corner of the oxidised and hotter grid. This tells me a couple of things. These Jun formulations prefer cone 10 to 11 and they want reduction. It also tells me that I should design my next grid test with DP1180 at the center, and see what happens as I move in various compositional directions… more silica one way, more potassium flux another, more granite another. My suspicion is that this glaze would like even more silica to be a more reliable Jun.
Here are the firing schedules from those two firings with their respective cone packs below them (cone 10 on the left, cone 11 on the right):
Finally, here’s my little helper in the glaze room at USU (my daughter Juniper: about 21 months old here!), then a bowl glazed with the central glaze in the grid, DP1197. You can see the Jun effect a little but it is still not quite there.
Until the next round of tests! Hope you are having a wonderful day!
Jun (Chün) glazes demystified
INTRODUCTION
Jun (or Chün) wares have long fascinated me. Every time I go to London, I make a pilgrimage to the Victoria & Albert Museum to see them, and delight whenever I see them elsewhere. Their luxurious, opalescent surfaces captivate my imagination and make me want to try to create similar glazes. Many commenters have said they have the “appearance and feel of finest jade” (Kingery & Vandiver, p. 1269). Jade was all the rage in Song Dynasty in China, so this may have been the goal of the potters.
These glazes were long a mystery, and no one knew exactly how they were produced. We are lucky to be alive now! Modern academics and potters alike have run extensive tests and come up with some answers.
I have read all the accessible resources I could find about these glazes, and in this blog, I lay out the pertinent findings. This endeavor, to understand Jun glazes, is primarily to help guide my own glaze experiments with local materials. I warn you, it is a long blog post, but that’s what demystification takes sometimes!
FIRSTLY THOUGH, WHAT ARE JUN GLAZES?
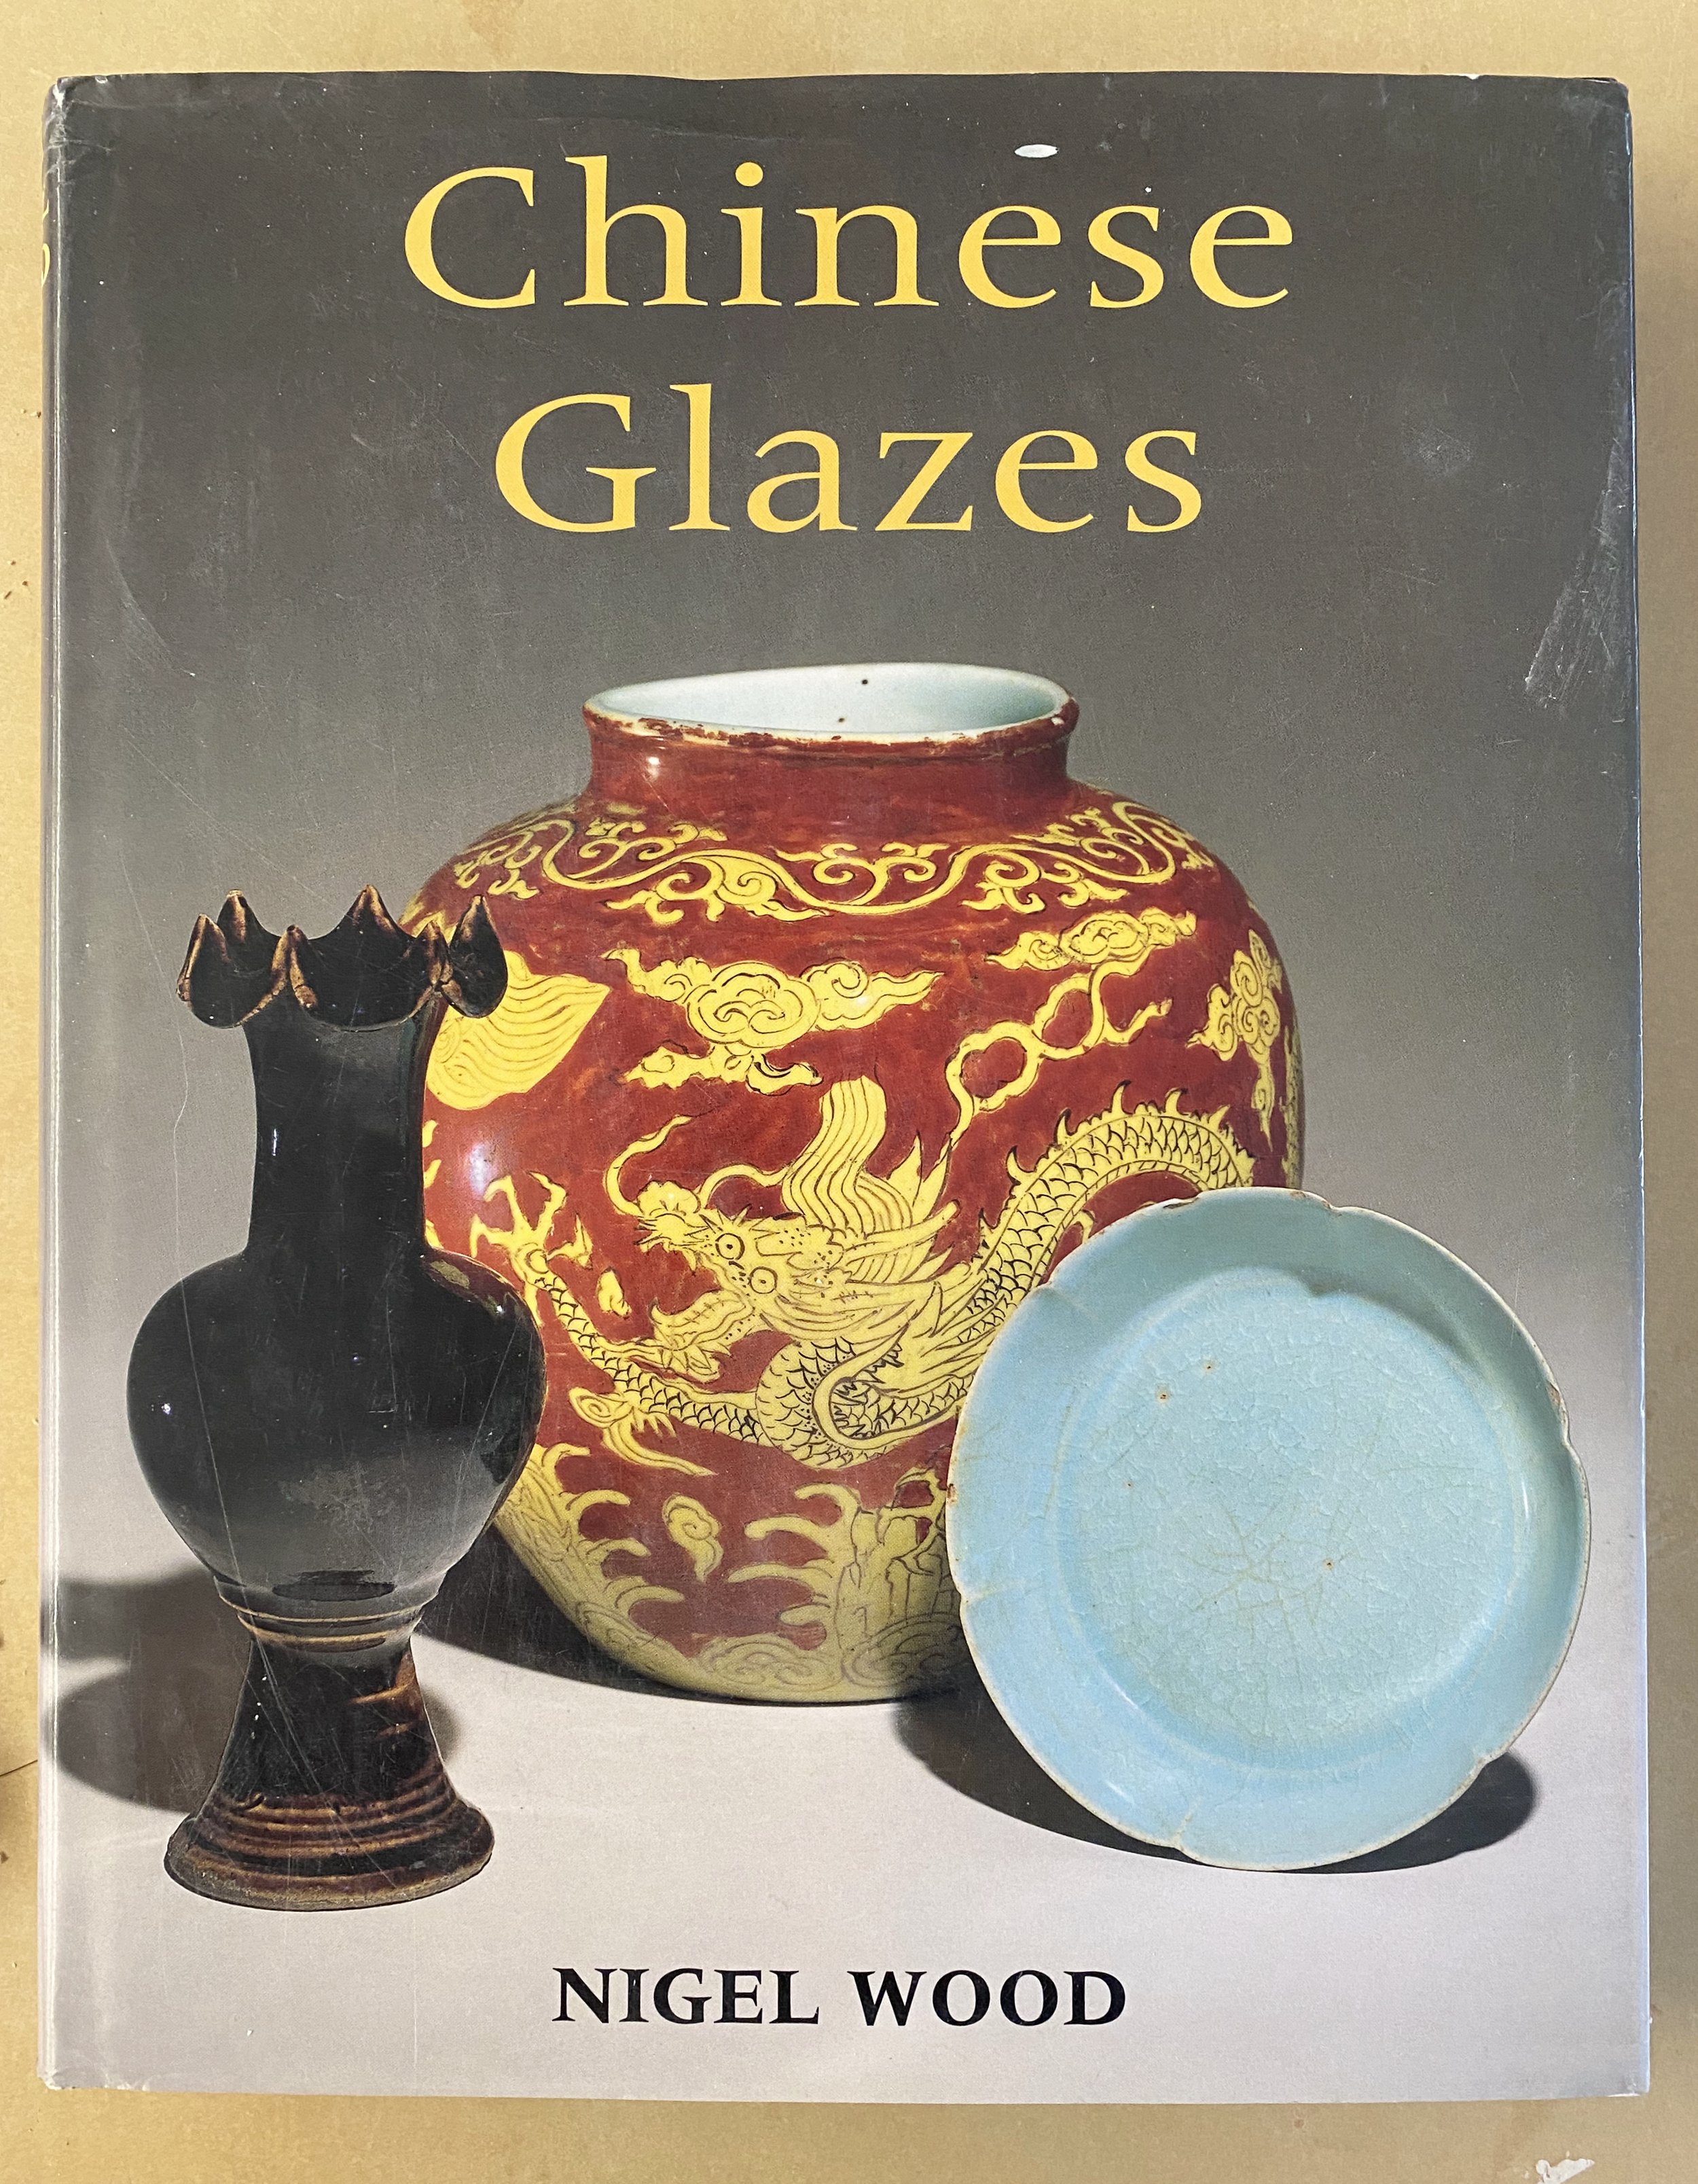
Nigel Wood, author of the outstanding book Chinese Glazes, says Jun wares are characterized by “heavier bodies, and unusually thick bluish glazes” (Wood, p. 118). But rather than go into a long description of these glazes and their variants, it’s probably easier to show you, so here are some examples from the Victoria & Albert Museum…
As you can see from these pictures, and the ones below, these glazes vary a huge amount. Their cloudy, opalescent colors can vary in color from green to sea foam, to aquamarine, to darker blues, lavender, white, and all of the tones in between these. The surface of these glazes are dimensional, meaning there are hidden depths. They are thick and curdled, but feel like satin. They often have pin holes or pits, and sometimes strange “earthworm tracks” or lines that meander across them.
Here are some more lovely examples, from the Freer Gallery in Washington D.C…
WHEN AND WHERE ARE THEY FROM?
Jun wares originated in China, in Henan Province, during the Song Dynasty. Here’s what Sotheby’s (the auction house, which occasionally sells these pots) says, “‘Jun’ ware, with its type site represented by the Juntai kilns in the former region of Junzhou, modern-day Yuxian, Henan province, was produced by many different manufactories in Henan, including the Ru kilns at Qingliangsi in Baofeng, probably from the end of the Northern Song period (960-1127AD) until at least the Ming dynasty (1368-1644).” We can see why the glaze is called Jun, coming from the Juntai kilns in Junzhou. People use the terms Jun and Chün interchangeably, but I am going to stick with Jun through this post.
Nigel Wood adds to this, saying that although the main Jun ware-producing kilns were in the “Yu and Linru counties of Henan province,” there were several other kilns outside of Henan, too (Wood, p. 118). He estimates that “production began in the late 10th Century and may have continued into the early 15th Century” (Wood, p. 119).
WHAT’S THE MYSTERY ALL ABOUT THEN?
Jun glazes have been “the most admired and least understood of Chinese high fired effects” (Wood, p. 119). They have a “mysterious quality,” which many have guessed about over the years. Quick note: When I say “Jun effect” during the rest of this post I am using it as a shorthand for the mysterious cloudy blue opalescence we see in the best Jun glazes of the Song Dynasty.
The mystery of Jun glazes is the big question… how did they do it? What in the glaze composition causes these miraculous opalescent surfaces?
In his much-loved book Pioneer Pottery (published in 1969), Michael Cardew says, “Potters used to think that grass ash, or a high silica ash, was essential to obtaining chun opalescent glazes. But there seems to be a survival of the theory, now discarded, that opalescence was due to undissolved silica—a theory based on a supposed analogy with natural opal” (Cardew, p. 41). We know now that real opals and opalescence in glazes function differently, so this is not the best line of enquiry.
Cardew discusses other theories, too, and then concludes, “Since the theory of these colors is still uncertain, any rules on how to produce them must be purely empirical, based on evidence which is inevitably partial and incomplete.” (Cardew, p. 142). In other words, it’s anyone’s guess.
Before the 1980s, the prime suspect for creating opalescence was phosphorus. Indeed, many people today still think phosphorus is the key to creating the Jun effect. Analysis by Kingery and Vandiver dispelled this myth in their article, “Song Dynasty Jun (Chün) Ware Glazes,” published in 1983. They showed that whilst phosphorous may help, it is not the main factor contributing to the Jun effect.
In Chinese Glazes, published in 1999, Nigel Wood summarizes the guesswork to date: “During the last 60 years the extraordinary visual qualities of Jun glazes have… been attributed variously to iron phosphate, to colloidal silica, to lime phosphate or suspended carbon, and to mutually insoluble glasses” (Wood, p. 119). We needn’t go into all these theories here!
WHAT DOES THE SCIENCE SAY THEN? HOW DID THEY DO IT? DEMYSTIFY ME!
After admitting to not really knowing how Jun effects are produced, Michael Cardew says, “It is, however, generally agreed that they are optical colors; and the most likely hypothesis is that they are produced by a suspension of liquid in liquid (or rather glass in glass)[1] (Cardew, p. 142). He was on the right track here!
When Cardew talks about Juns being “optical,” he means as opposed to “pigmented.” Normally, colors in glazes are “derived simply from oxide pigments that are in suspension.” How do we know this is not the case with Jun glazes? As Wood says, “It is possible to confirm the absence of genuine blue coloring particles, or dissolved blue-coloring ions, in Jun glazes by holding a sliver of Jun glaze up to the light: the glaze appears straw-colored and its blue tone disappears entirely” (Wood, p. 120). You can see this straw color on some Jun wares where the glaze is thin, such as on the rims of bowls.
Something else is going on with Jun glazes then. The blue color is optical… in the same way that the sky looks blue to us. Okay, remind me — why does the sky look blue again?
Here is a snippet from a physics website, explaining it better than I can:
If you don’t fully get it, check out this youtube video from NASA. It’s all about the way particles in the atmosphere scatter light on the way to our eyes, making the sky seem blue. This same phenomenon is going on with the bubbles in Jun glazes.
Kingery and Vandiver explain that the creation of these bubbles it is all about liquid-liquid phase separation, “wollastonite grains have a size in the submicron and micron particle size range, giving them very effective scattering power and a white cloud effect in addition to the blue opalescence of the liquid-liquid phase without crystallization” (Kingery & Vandiver, p. 1172-3). This is written in complex language, but Tichane explains it too: “Where crystals and bubbles in glazes have the effect of making them translucent or white appearing, the true opal in Chun ware also has a coloring effect. Because of the small size of dispersed droplets (~2000A.), light is diffracted as it passed through the glaze and the result is that it appears brown in transmitted light and blue in reflected light. Since glazes are viewed in reflected light rather than transmitted, this bluish opalescence reinforces the celadon blue of a Chun glaze” (Tichane, p. 178). Glazes are not viewed in transmitted light because of the opaque clay body underneath them: Light cannot pass through the clay. This backdrop of the clay body necessarily reflects the light.
Nigel Wood agrees, saying the Jun effect is caused by “minute spherules of glass within the Jun glazes were scattering blue light” (p. 120). The size of the bubbles plays a role in determining the color of the glaze; “the ‘moon white’ qualities of slightly underfired Jun glazes are analogous to emulsions like milk, where minute droplets of fat, suspended in water, also scatter white light. In these underfired glazes the separated droplets are larger, but as firing temperatures increase, the droplets that develop in cooling are smaller, changing the glaze color from white to blue then, with more heat, to blue with a hint of purple. This ‘emulsion’ phenomenon sets Jun glazes apart from the general run of Chinese glazes” (Wood, p. 120).
Cardew surmised, “if the majority of the suspended globules are between 0.45 and 0.5µm in size, the color will be blue” (Cardew, p. 142). Wood points out, though, that it is not this simple; “the glass droplets in Jun glazes average 0.8µm and are therefore considerably finer than the wavelength of blue light (0.4-0.5µm), but through an interference effect known as Rayleigh Scattering, they supply a strong lush cast to Jun ware glazes” (Wood, p. 119-120). Thus, Jun glazes appear blue in the same way that the sky appears blue to us.
WHAT DO WE MEAN BY LIQUID-LIQUID SEPARATION EXACTLY?
Tichane lays it out in his discussion of phase separation:
“By phase separation we mean the simultaneous appearance of:
1) A gaseous phase (bubbles) in a liquid phase (glass); or
2) A liquid phase (droplets) in a liquid phase (glass); or
3) A solid phase (crystals) in a liquid phase (glass)
Common kitchen varieties of these kinds of phase separation are:
1) Meringue or whipped cream – air dispersed in a liquid
2) Mayonnaise – oil dispersed in an aqueous solution.
3) Fudge – Fine sugar crystals dispersed in a liquid.
The visual effect in both kitchen and glaze cases is to convert more-or-less transparent base liquids into translucent, opalescent, semi-opaque systems.” (Tichane, p. 173)
It is the liquid-liquid separation in the Jun glaze that accounts for the multitude of bubbles in it, which scatter the light and appear opaque and blue to us.
In his immaculately researched book, Ceramic Glazes, Parmelee says there are various systems in which liquid-liquid separation can occur. He reiterates the importance of the size of the bubbles; “The dispersed spherical particles responsible for the opacity had particle sizes in the range of 0.1 micron to 0.5 micron. Furthermore, when reheated these compositions precipitate extremely fine crystals that still further increase opacity” (Parmalee, p. 23).
Kingery and Vandiver isolate the Jun system of phase separation: “The principal constituents in Song porcelain glazes are K₂O, CaO, Al₂O3, and SiO2. Their proportions correspond to compositions in the phase tetrahedron bordered by the crystalline phases: wollastonite, anorthite, orthoclase, and cristobalite, as illustrated in Fig. 2” (Kingery & Vandiver, p.1270).
Do I fully understand this diagram? Not really. However, I find it encouraging that Kingery and Vandiver mapped these glazes so specifically. Smarter folks than I! Here’s another diagram from them; Fig. 4, below, shows the area of liquid-liquid phase separation.
We can see in this diagram that the Jun glaze compositions sit along the boundary of the region in which liquid-liquid phase separation occurs (Kingery & Vandiver, p. 1274).
This demonstrates again that Jun glazes lie in a very specific compositional zone. The silica concentration of these Song glazes is “fairly constant, falling in the range 70-73% SiO2. Along the joint between SiO2 and wollastonite, CaSiO3, the glaze can separate into two liquid phases, one rich in silica and one closer to the composition of wollastonite” (Kingery & Vandiver, p. 1270). Now we are getting somewhere. These are the liquid glasses of the liquid-liquid phase separation: one being silica rich, and the other closer to wollastonite (CaSiO3).
NOW WE KNOW WE’RE AIMING FOR THIS ZONE: WHERE THE GLAZE SPLITS. HOW DO WE ACHIEVE THIS?
Of foremost importance is the alumina:silica balance of the glaze. Kingery and Vandiver show that Jun glazes contained between “69-73% silica and just under 10% alumina,” compared to Longquan celadon glazes which contained more like “68% silica and 14.5% alumina, with the rest of the oxides being relatively comparable” (Wood, p.121).
In his recent book, Rock Glazes Unearthed, Matt Blakely corroborates this, “There are numerous factors that come in to play here but the primary requirement is balance. The flux:alumina:silica ratio must be within a rather narrow area on the glaze map that produces a glaze just on the border between clear and opaque.” He goes on, “the balance is dependent on a low alumina (around 0.3 is common) and high silica (an alumina: silica ratio of around 1:12). Alumina inhibits the effect. Too little silica and the glaze is clear, too much and it is opaque” (Blakely, p. 122).
He goes on to say he has produced Jun glazes with “alumina levels ranging from 0.32 – 0.42 but it seems to be best if the alumina comes from the feldspars in igneous rocks rather than clay” (Blakely, p. 122-3). In terms of silica, he says it is “desirable that the silica present is as fine in particle size as possible. Straw or grass ash would be useful, otherwise I suggest the silica containing rocks are milled as fine as you are able” (Blakely, p. 123). This somewhat contradicts what Tichane says about silica particle size causing variation, but we will get to a discussion of inhomogeneity later.
From my research and plugging in various recipes to Glazy, it seems that the alumina:silica ratio of Song Dynasty Jun glazes was often 1:11-1:13 or so. Blakely advises, “when using granite as the feldspar source, slightly higher is often needed to find that intermediate zone between clear and opaque.” (Blakely, p.123) This is very helpful advice, especially as I am using granite as my feldspar source.
Here is a chemical analysis of a violet Chun glaze from “Sung Sherds” (p.416) by Nils Sundius and other contributors:
What do we notice about this composition? The glaze has a silica:alumina ratio of 12.43. This is high silica, low alumina, as the literature suggests. It also has plenty of calcium, which several sources point to as important. This stands to reason if one of the liquids in the phase separation is wollastonite (requiring calcium). The titanium content is very low. It has some phosphate but not a ton. Quite a bit of potassium compared to sodium. A little magnesium. And some iron. Iron helps bring out the blue color, despite this being an optical rather than pigmented glaze.
In terms of the magnesium, Blakely has some advice: “In my own experience small amounts of magnesium are beneficial in calcium/alkali glazes. Too much and the magnesium will cause the surface to crystallize.” I have seen others, such as Cardew (p. 143), mention that a bit of talc can help encourage the Jun effect (talc is a magnesium source). Blakely continues with some advice about making Juns that are stable: “… while the Chun effect occurs in high calcium glazes, these low alumina glazes tend to be very runny so the effect can only be seen where the glaze pools in runs or on flat surfaces. To produce a relatively stable Chun glaze that can be fired to a uniform thickness, a higher alkali flux content is beneficial (around 0.25-0.3)” (Blakely, p. 122).
Kingery & Vandiver advise, “Higher silica content and additions of titania transform the iron coloration toward a more greenish hue. To obtain good Jun blues, low titania raw materials are necessary” (Kingery & Vandiver, p. 1173). Nigel Wood dedicates a whole article to this Nought-Point-Two per Cent Titanium Dioxide: A Key to Song Ceramics? in which he concludes that low titania (below 0.2%) is necessary to achieve a blue celadon.
I would also add, from my experience, that celadons and other glazes using a low percentage of iron as colorant tend to be greener in oxidation and bluer in reduction.
THE ELEPHANT IN THE ROOM: WHAT ABOUT PHOSPHORUS?
As I mentioned before, there was a time when folks thought phosphorus was the answer to making a successful Jun glaze. Whilst it is now thought of as not the answer, almost all recipes I have seen include some bone ash to provide phosphorous anyway.
It comes back to liquid-liquid phase separation: “The positive role of phosphate in these glazes is related neither to opalescence, nor to the iron coloration, but rather to its influence on bubble formation… a sample melted without phosphorous additions shows a uniform size bubble population, whereas samples melted with 1% addition of bone ash show a range of bubble sizes. Similarly, in experiments melting larger batches of material, opacity was unaffected, but bubble formation greatly increased when 1% bone ash was added to the formulation” (Kingery & Vandiver, p. 1273).
Tichane corroborates this: “Chun is really a high silica opal that is triggered and accentuated by phosphate. A lovely blue opal can be formed by adding more and more silica to a lime-feldspar glaze, but at any stage of the process the opal can be greatly identified by the addition of 0.5% phosphate” (Tichane, p. 68).
So, it does seem like phosphorus helps Jun glazes, but is not the main factor in causing them. Blakely agrees, “Although phosphorus seems to enhance the Chun effect, the flux:alumina:silica balance is more important. Glazes with P2O5 outside this balance do not exhibit the effect but, even more strikingly, glazes with no phosphorus content but just the right balance seem to spontaneously develop phase-phase separation within their glass” (Blakely, p. 122).
These is still some debate over where the phosphorus in Song Dynasty glazes came from. Tichane reckons, “The Chinese undoubtedly provided the phosphate by ash additions to the glaze slip. Many ashes contain 5% phosphate, thus a 10% addition to a glaze would provide 0.5% phosphate. I have used a 1% bone ash supplement to get the same effect and yet avoid other complicating contaminants” (Tichane, p. 69). These “complicating contaminants” in wood ash could potentially add extra interest, though. Tichane points out that it was the wood ash in Chien (tenmoku) glazes that gave hares fur effects. I will experiment using wood ash in some of my recipes to check this out.
There is some doubt over the use of wood ash in some Song Dynasty Jun glazes though. In that chemical analysis of a Jun glaze I included earlier (from Song Sherds), the manganese level was suspiciously low, as Nigel Wood points out: “MnO levels are extraordinarily low (average 0.05% MnO) – which may throw some doubt on the generally accepted view that Jun glazes contained substantial amounts of wood ash. However, almost uniquely, a wood-ash sample from a Henan Song kiln site has been shown to have contained only 0.08% MnO, so it may be that wood ashes that were particularly low in manganese oxides were available to Jun ware potters” (Wood, p. 124). It is hard to know exactly what materials these potters were using, but I would bet they primarily used a clean silica rich granite as the main ingredient, with some lime and/or wood ash as flux. Wood ash often also provides iron which helps the blue color. It seems unlikely that they were calcining and powdering bones for inclusion in their glazes. I might be wrong, though!
Another potentially interesting option could be the use of “clinker.” In Pioneer Pottery, Cardew gives his Jun recipe, which included 35% VF slag. He describes this as a “kind of ‘accidental’ frit: “In kilns fired with wood, the ash (if it contains enough silica), will, in the hottest places, melt to a clinker, not unlike the clinker formed in furnaces.” Cardew analsyed this material and found it high in calcium phosphate as well as containing some magnesium. It is possible to save this material, crush it up and use it.
WHAT ABOUT THE CLAY BODY?
As potters, we all know the influence of our clay body on our glazes. Any glaze will look different on porcelain as opposed to a dark iron bearing clay.
Cardew says, “The influence of the body or slip is very great. Because it is an optical effect and not a stain, a chun color will be deep blue over a dark slip, and still better over a dark glaze, nut oily and almost colorless over a light body” (Cardew, p. 143). Cardew footnotes here that the late T. Matsubayashi (St Ives, 1923) gave him a simple recipe for producing chun blue: use an ash glaze over tenmoku.
This was obviously Cardew’s experience, and I don’t doubt this was true for him, but I am a little skeptical. Most of the examples of Jun ware I have seen have been on pale, buff clay bodies and they were by no means colorless.
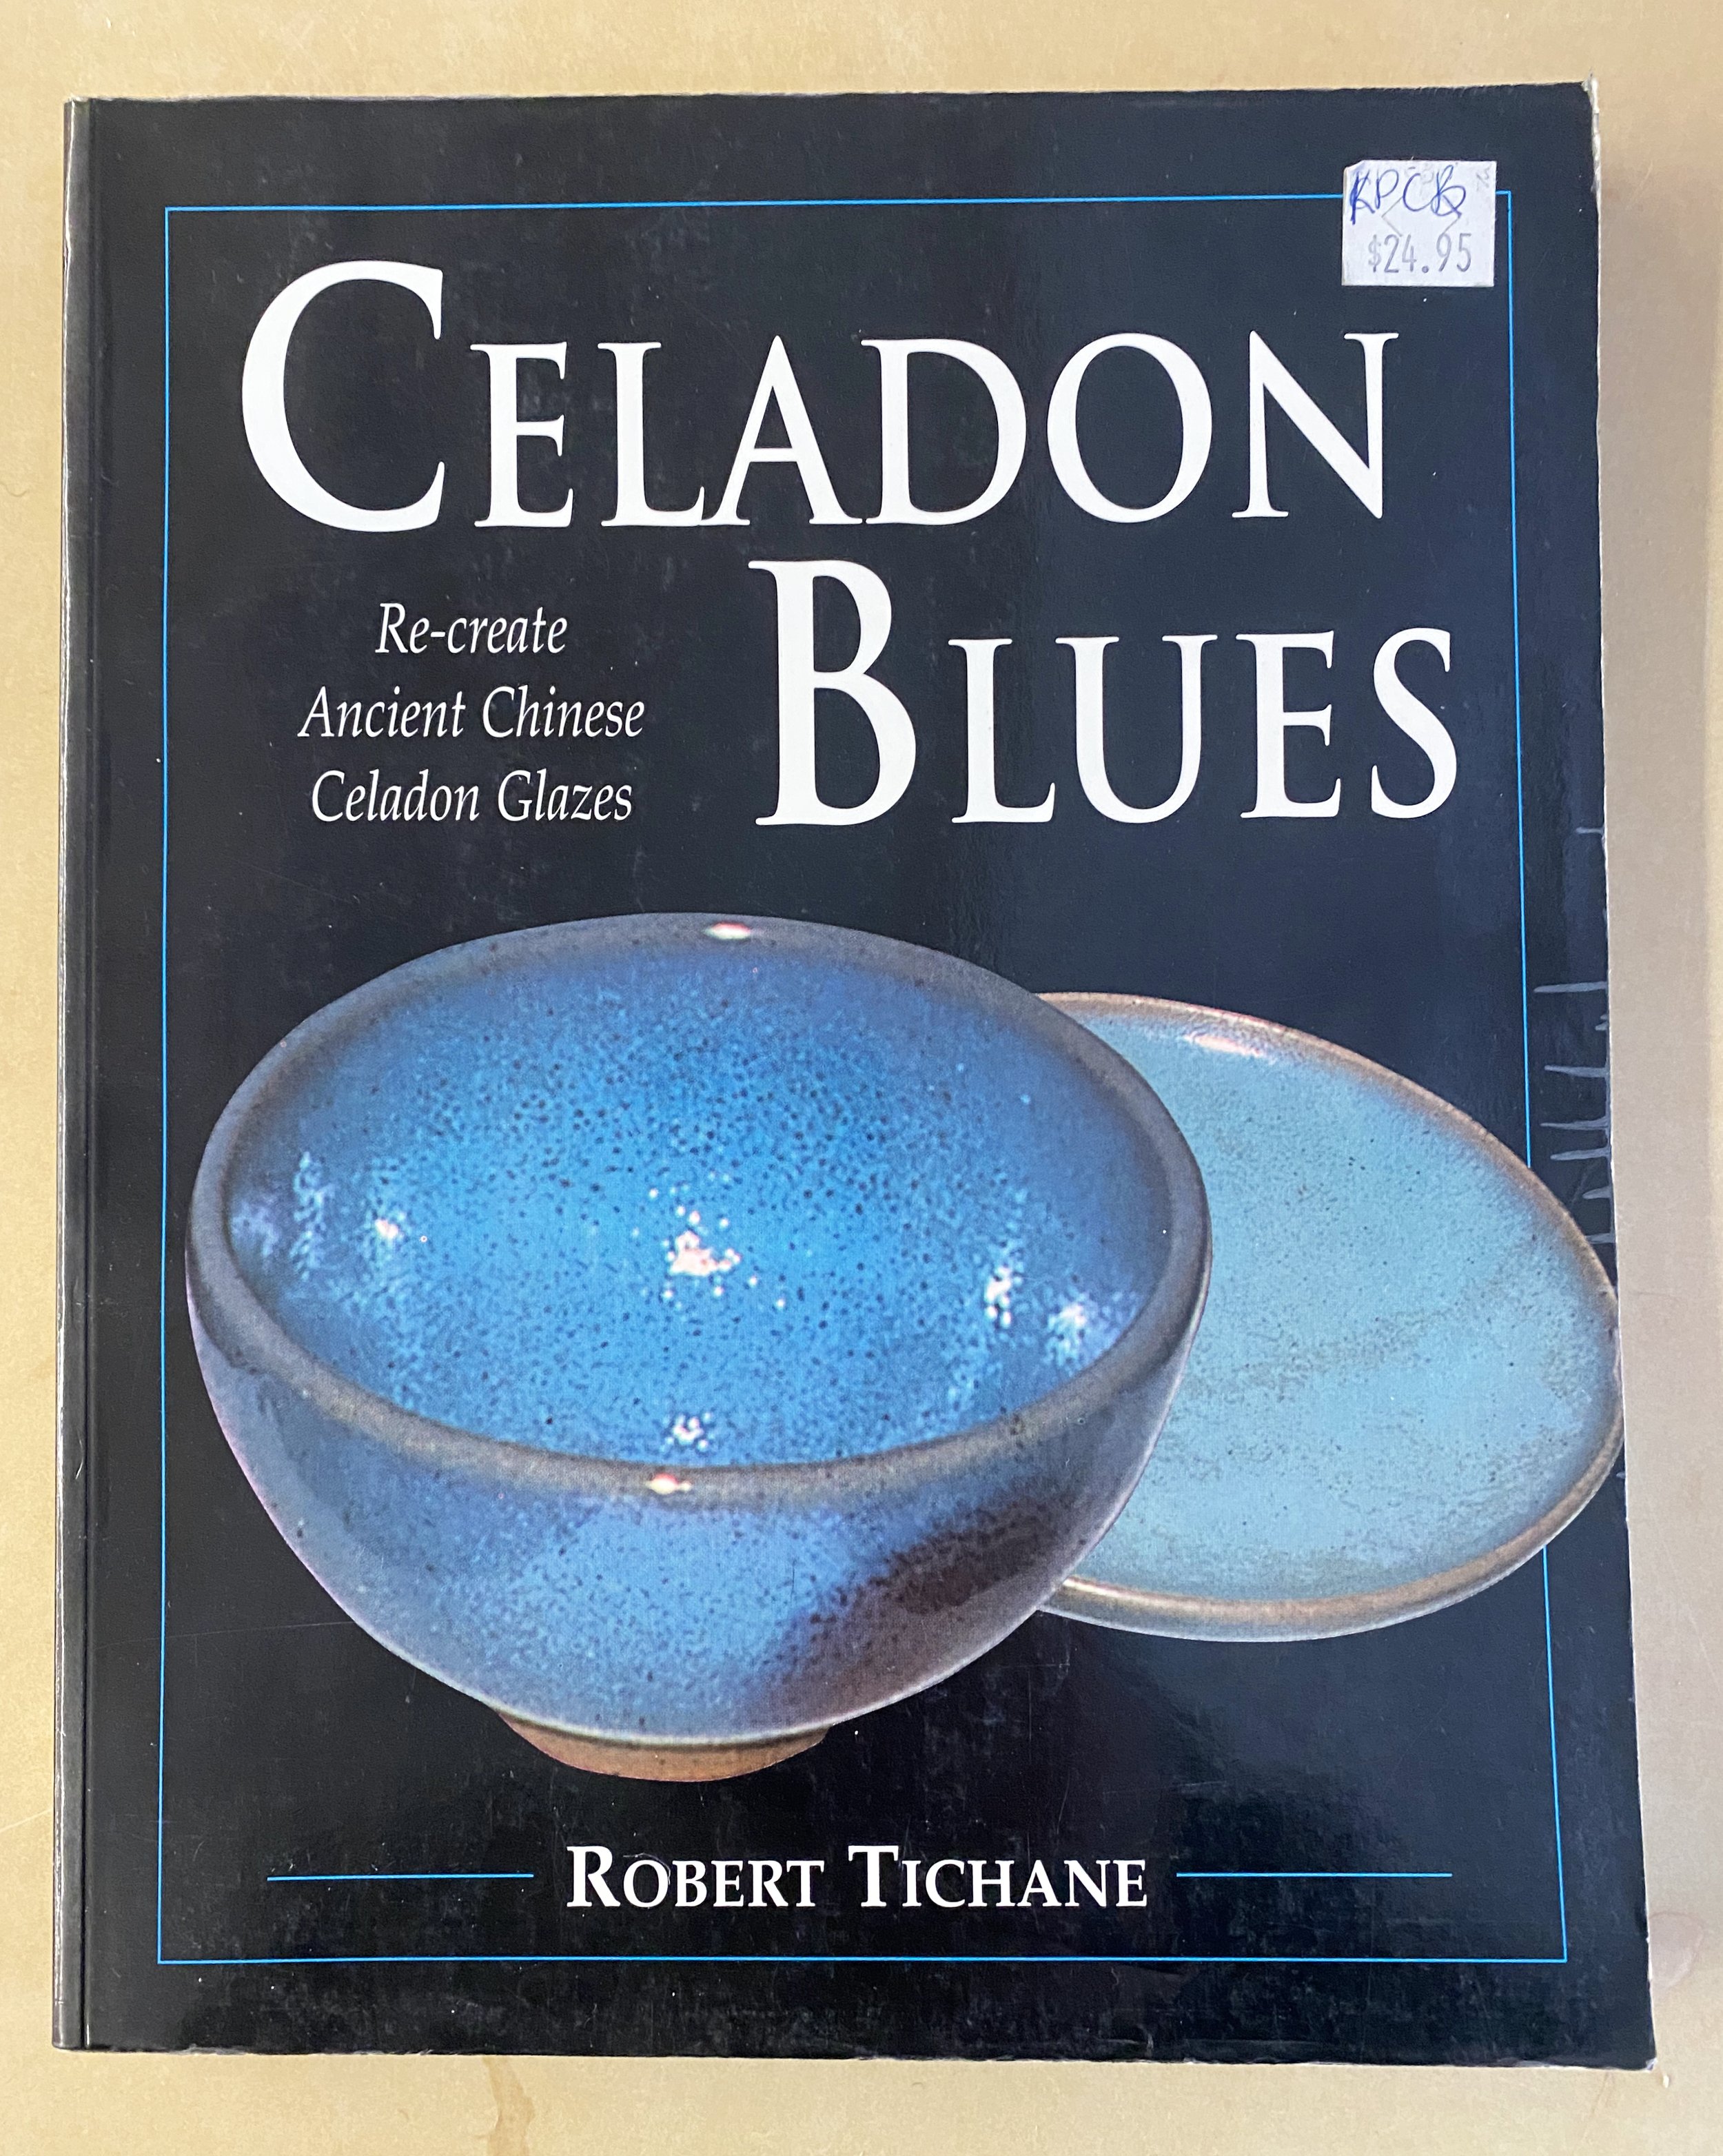
Tichane goes into good detail about the clay bodies of Song Jun wares: “The bodies of some early Chun ware are a little unusual for Sung because they are porous and sandy appearing in contrast to the porcelaneous nature of other contemporary bodies (Lung-chu’an, Yueh, Ting)… what it amounts to is that the Chun body is quite refractory and lacking in fluxes, therefore even though it is high fired, it has not become dense… analysis shows the high alumina, low potash content which would make this body quite refractory” (Tichane, p. 70).
Nigel Wood, Sotheby’s and others agree that Jun wares were generally more “thickly potted” than other wares from that period. We can also see this is true from examples of Jun wares that broke. I think the heavier walls of the pots were to allow for a thicker glaze application.
OTHER CONSIDERATIONS: GLAZE THICKNESS
Thickness is very important. You can see this on the rims of Jun bowls; where the glaze is thinner it doesn’t have the opalescence. You can see this on the underside of some Jun pots, too, where the glaze was applied less thickly.
Tichane emphasizes this, “There is one quality that distinguishes Sung ceramics from all other historical pieces – glaze thickness. If one compares Chun, Kuan, Lung-ch’uan, Chien, or Tz’u-chou to modern glazes, the one outstandingly different feature is thickness.” (Tichane, p. 159). He suggests doing a thick layer of glaze (dipped) and then spraying more on top. You can also try multiple layers, but cracking may occur.
Wood hints at why thickness is so important; “no opalescence appeared where the glazes were thin, because alumina from the clay body dissolved into the thin glaze and upset the ‘ideal’ oxide balance” (Wood, p. 124).
OTHER CONSIDERATIONS: FIRING!
The first thing to say is that temperature is important. This is kind of obvious, but with these glazes, there can be a vast difference from cone 9 to cone 11. Blakely says, “Too little heat and the Chun will be white and opaque, too much and it will be transparent” (Blakely, p. 123). Cardew agrees with this, “The colour also to some extent depends on temperature: at the lower end of the range the glaze will be opaque, with a pale-blue bloom; at the optimum temperature a stronger color develops; at still higher temperatures, only a few flecks of blue are left in an otherwise clear glaze” (Cardew p. 143). I have found this in my own experiments. Too hot and they become celadons again.
The biggest hints I think we should look for are from the historical practices of the potters in the Song Dynasty; “Jun wares were fired in both coal- and wood-burning kilns, and were set in coarse fireclay saggers, usually with one piece per sagger” (Wood, p. 119). Here is one from the collection of the Philadelphia Museum of Art:
Saggars played two main roles. They protected the pots from wood ash and encouraged a slow cooling of the pot. Thick-walled hard brick kilns also encouraged slow firings. I had wondered about how saggars affected the local atmosphere around each piece. Wood says, “Reducing gases pass easily through refractory saggars… but with more vitreous saggars, made from finer clays, perforations were sometimes necessary for good reduced effects” (Wood, p. 119).
Indirectly, this also hints at the importance of reduction to these glazes. Wood provides three Jun bowls on p. 119 SHOW THIS! fired to different temps and the difference in color of them due to this.
It is generally agreed that Jun glazes want reduction. Blakely says it is “essential” (Blakely, p. 123). Only Cardew disagrees, saying “the glaze is unaffected by variations in reduction or oxidation” (Cardew, p. 143). Much as I love Cardew, this is hogswallop. I have seen in my own experiments that the colors and Jun effects are much more pleasing in reduction.
A major difference between kilns of this area and most kilns today was that they were built much thicker and often into a hillside. Most kilns in Honan were “built partially underground or surrounded with a thick layer of local soil.” (Kingery & Vandiver, p. 1274). This extra insulation meant that these kilns took a long time to heat up and also a significantly longer time to cool down once a firing had finished.
In their experiments, Kingery and Vandiver found that opalescence was only achieved in a reduction firing that was held at 1000oC (1832oF) during the cooling. They found “a fine-scale liquid-liquid separation took place during rapid cooling… but when a sample was held at a high temperature coarsening of the structure developed, and wollastonite precipitation occurred simultaneously with an increased size of the droplets” (Kingery & Vandiver, p. 1271). That is to say, the phase separation was enhanced with a slower cooling… the “the characteristic color and opalescence of Jun glazes appear during the cooling.” This is a big clue, indicating that “the rate of cooling is an essential consideration.” (Kingery & Vandiver, p. 1272).
Nigel Wood also relays the importance of the cooling cycle: “The qualities seen in true Jun glazes, however, are not solely the result of liquid phase separation effects – they can also show a pronounced milky streakiness, sometimes combined with a white ‘sugary’ mattness, in addition to their famous opal-blue colors. These extra qualities seem to have been caused by some micro-crystallization in the glazes of the lime-silicate mineral wollastonite during cooling… The growth of wollastonite in Henan Jun glazes was encouraged by the unusually long time that Jun glazes took to cool down – a consequence of the thick walls of the Jun ware kilns, and the heavy fireclay saggars in which the Jun wares were set. South Chinese glazes (like the Wuzhou Jun’s cooled rather too fast for these lighter streaks and patches to develop, giving shinier and generally less interesting effects” (Wood, p. 123).
Even if we do not have a kiln with thick walls, saggers and extra soil insulation, we can get around this by downfiring our kilns. Whether it be wood, gas or electric, we can control the cooling cycle by adding fuel.
I will be trying various slow cooling cycles to see what works for my granite-based Jun recipes.
OTHER CONSIDERATIONS: COPPER
Copper can look absolutely stunning in combination with Jun glazes. It can turn the glaze various shades of reddish purple. Tichane investigated the use of copper in the Jun wares of the song Dynasty.
He says, “An analysis of their origin {the purplish copper areas} is complicated by the fact that copper is both mobile and fugitive in high temperature, reducing fires… Copper’s mobility can be demonstrated by painting the inside surface of a bisque bowl with copper nitrate solution. After glazing and reduction firing, the copper-red color will be found on the outside glaze surface” (Tichane, p. 71). Here Tichane shows a diagram where he painted some copper nitrate on the inside of a bowl and then it did not just appear on the inside of the bowl, but also on the outside. This was surprising to me. It actually went through the clay body.
Tichane finds that copper can volatize completely from a long-fired piece (Tichane, p. 71). Watch out for this!
He lays out a number of choices available if one wants to apply copper to pots: “One can make solutions of copper nitrate or sulphate and paint these either on the body or on the raw glaze. However, the concentration of the solution is critical, for with too little copper there is no copper at all, and with too much copper, greens result.” This sounds difficult to dial in.
He also says, “Insoluble copper compounds can also be applied. And again the concentrations are important. Copper carbonate is easier to apply that copper oxide, but either compound trends to a dark green color when applications are heavy.” Seems like it is tricky to get it just right. Even on surviving Sung pots you can tell the potters got it wrong sometimes, “their copper splashes are often either faint or discolored by green patches.” (Tichane, p. 72). Regardless of the apparent pitfalls, I think it is worth experimenting with.
A FINAL CONSIDERATION: INHOMOGONEITY
You thought we were done? No, no. Add a spoonful of inhomogeneity. Don’t panic, we are deep down the Jun ware rabbit hole.
Kingery & Vandiver analyzed many Jun glazes and concluded that some of the depth and variation in them was due to “optical inhomogeneities within the glaze.” These inhomogeneities include “liquid-liquid phase separation a few tens of nanometers in extent, anorthite crystals, wollastonite crystals, undissolved batch material, cristobalite crystals, and glaze bubbles ranging in size from the submicroscopic up to nearly a millimeter in diameter” (Kingery & Vandiver, p. 1269).
To achieve the best chun glaze results, “the presence of cord or striae arising primarily from variations in the lime content on a scale of ~0.1mm is essential.” These come from inhomogeneities in the glaze mix.
How can we do this? They suggest considering the “way in which lime is added to the glaze, the milling time, and the uniformity of mixing.” They also suggest that “local compositional variations obtained from relatively coarse ingredients are required. Excessive milling will lead to uniform and not very interesting results… insufficient mixing with local areas of substantially different compositions will give rise to local opacity… according to one sample investigated by Steger and described in Sung Sherds, when local opacity was desired, it was achieved by introducing local clumps of fine quartz particles” (Kingery & Vandiver, p. 1274).
I will be trying various levels of ball milling in my search for my own Jun glaze. One easy way to go about this would be to mill most of the glaze but then add some of the batch at the last minute and not fully sieve it. Perhaps I will try just adding some larger grains of silica, too.
Parmelee also gives a nod on this topic, “Another source of mild opacity or for variations in opacity, is that of nonhomogoneity in the fused coating… an example would be a siliceous residue from a newly dissolved quartz grain…Because PbO and BO tend to lower surface tension in glasses, cords tend to diffuse more rapidly when they are present” (Parmelee, p. 23). Therefore, we can say that higher surface tension leads to more cords. If we want more cords and inhomogeneity, steer clear of PbO and BO in our Jun formulations.
CONCLUSION
I will let Tichane lead the way here. After analyzing Jun glazes on a microscopic level, he concluded:
- “Large crystals in the layer between the glaze and body; conclusion = high firing and slow cooling
- Undissolved silica stones in the glaze show large sized sand was used in the batch, while the surrounding cristobalite crystals indicate again that slow cooling occurred.
- Small glass droplets in the glaze represent the separated glass phase that is responsible for opalization. These also reflect a slow cooling process” (Tichane, p. 78)
Tichane concludes that slow cooling is very important and that the Jun glaze is a “high fired blue celadon with a coarse refractory body. The blue glaze is due to reduced iron in a siliceous base glaze to which added phosphate gives a market opalescence… the Sung Chun glaze was probably made with wood ash and a granitic stone” (Tichane, p. 78). This all seems reasonable to me.
My main conclusions from all this research are:
o You want a high silica:alumina ratio (test from 1:11 up to 1:16)
o Some iron (around 1.5%) is necessary
o A small percentage of phosphorus seems to help: 0.5-1%
o Low titania is ideal (under 0.2% if you can)
o You want more potassium as opposed to sodium content
o Calcium should be your main flux; whether its whiting, wollastonite or wood ash
o Reduction is important
o Slow cooling is important
o Inhomogeneity may help take the Jun to the next level
o Copper can look really nice, over or under Jun glazes
o Glaze thick! Then try thicker!
o Try different clay bodies
o Get some rest
I hope this article is useful to others in the future! I will be posting my next Jun glaze experiments soon!
Works Cited
Blakely, Matthew. Rock Glazes Unearthed. Matt Blakely, 2021.
“Blue Sky.” Blue Sky and Rayleigh Scattering, http://hyperphysics.phy-astr.gsu.edu/hbase/atmos/blusky.html#c1,Accessed January 10th, 2023.
Cardew, Michael. Pioneer Pottery. Longmans, 1969.
Kingery, W. D, and P. B Vandiver. “Song Dynasty Jun (Chün) Ware Glazes.” Journal of the American Ceramic Society, vol. 62, no. 11, Nov. 1983, p. 1269–1279.
Palmgren, Nils; Steger, Walter; Sundius, Nils; Westman, David, Sung Sherds. Almqvist & Wiksell, 1963.
Parmalee, Cullen W. Ceramic Glazes. Industrial Publications Inc, 1951.
Sotheby's. “Three of a Kind: Chinese Jun Ware Ceramics.” Sothebys.com, Sotheby's, 10 May 2019, https://www.sothebys.com/en/articles/three-of-a-kind-chinese-jun-ware-ceramics. Last accessed Jan 10th 2023.
Wood, Nigel. Chinese Glazes: Their Origins, Chemistry, and Recreation. University of Pennsylvania Press, 1999.
Wood, Nigel. “Nought-Point-Two per Cent Titanium Dioxide: A Key to Song Ceramics?” Journal of Archaeological Science: Reports, vol. 35, Feb. 2021.
Chun (jun) glaze initial tests
I have long admired chun glazes and dreamed of trying to create my own version with materials I collect locally. Three months before my thesis show in grad school seemed like a perfect time to start in earnest haha.
To begin the search I read up on chun or jun glazes from some of my favorite books.…
I also found the website Glazy very useful. I was able to take the analysis of Chinese chun glazes from the Song period (in Nigel Wood’s book) and target the composition using my locally collected granite.
I recently got my granite analysed by a wonderful lab at Washington State University. They took my granite, ground it up and ran it through an x-ray fluorescence machine. Normally it costs $120 a sample but as a student at a research institute I got each for $60. You have to post the samples to them too but they prefer to do all of the grinding. They just need more than 100 grams of the rock to analyse. I sent extra just to be safe.
You can read more about this and see the full analysis of my materials in this blog post.
Glazy is also helpful for the recipes on it already. I went through, compared them all and this helped me get an idea of where the chun zone was too.
I used glazy to target the Unity Molecular Formula of several song dynasty chun glazes from Nigel Wood’s book, and then also some others I found online from David Fry, Derek Au, Harlan House and Atelier Aimee. I basically tried to achieve the same UMF but using at least 50% of my granite from Devil’s Playground, Utah.
I tinkered around for a while on glazy and came up with 12 possible chun glazes. I mixed up 100 grams of each, weighing out he ingredients carefully and adding 55ml of water to them. I sieved each twice and then dipped 4 test tiles in each, to be fired in different ways. I also dipped one large extruded test tile in each (in a trough): I like these larger tiles for seeing what happens on a larger surface but they do not tell you how runny the glaze will be.
Here is the first set in the kiln, fired to cone 10. Cone 11 is still standing there.
Initially I was disappointed upon examining the tests. I was hoping for a varied line up of chun glazes. See my last post for some pictures of what I was hoping for. Not this haha. These look very much like celadons of various shades. However, upon close inspection I could see the beginnings of chun effects… the beginnings of liquid-liquid phase separation, and of bubbles clouding the surface.
Here is a closer look at each of the tests, with their recipes…
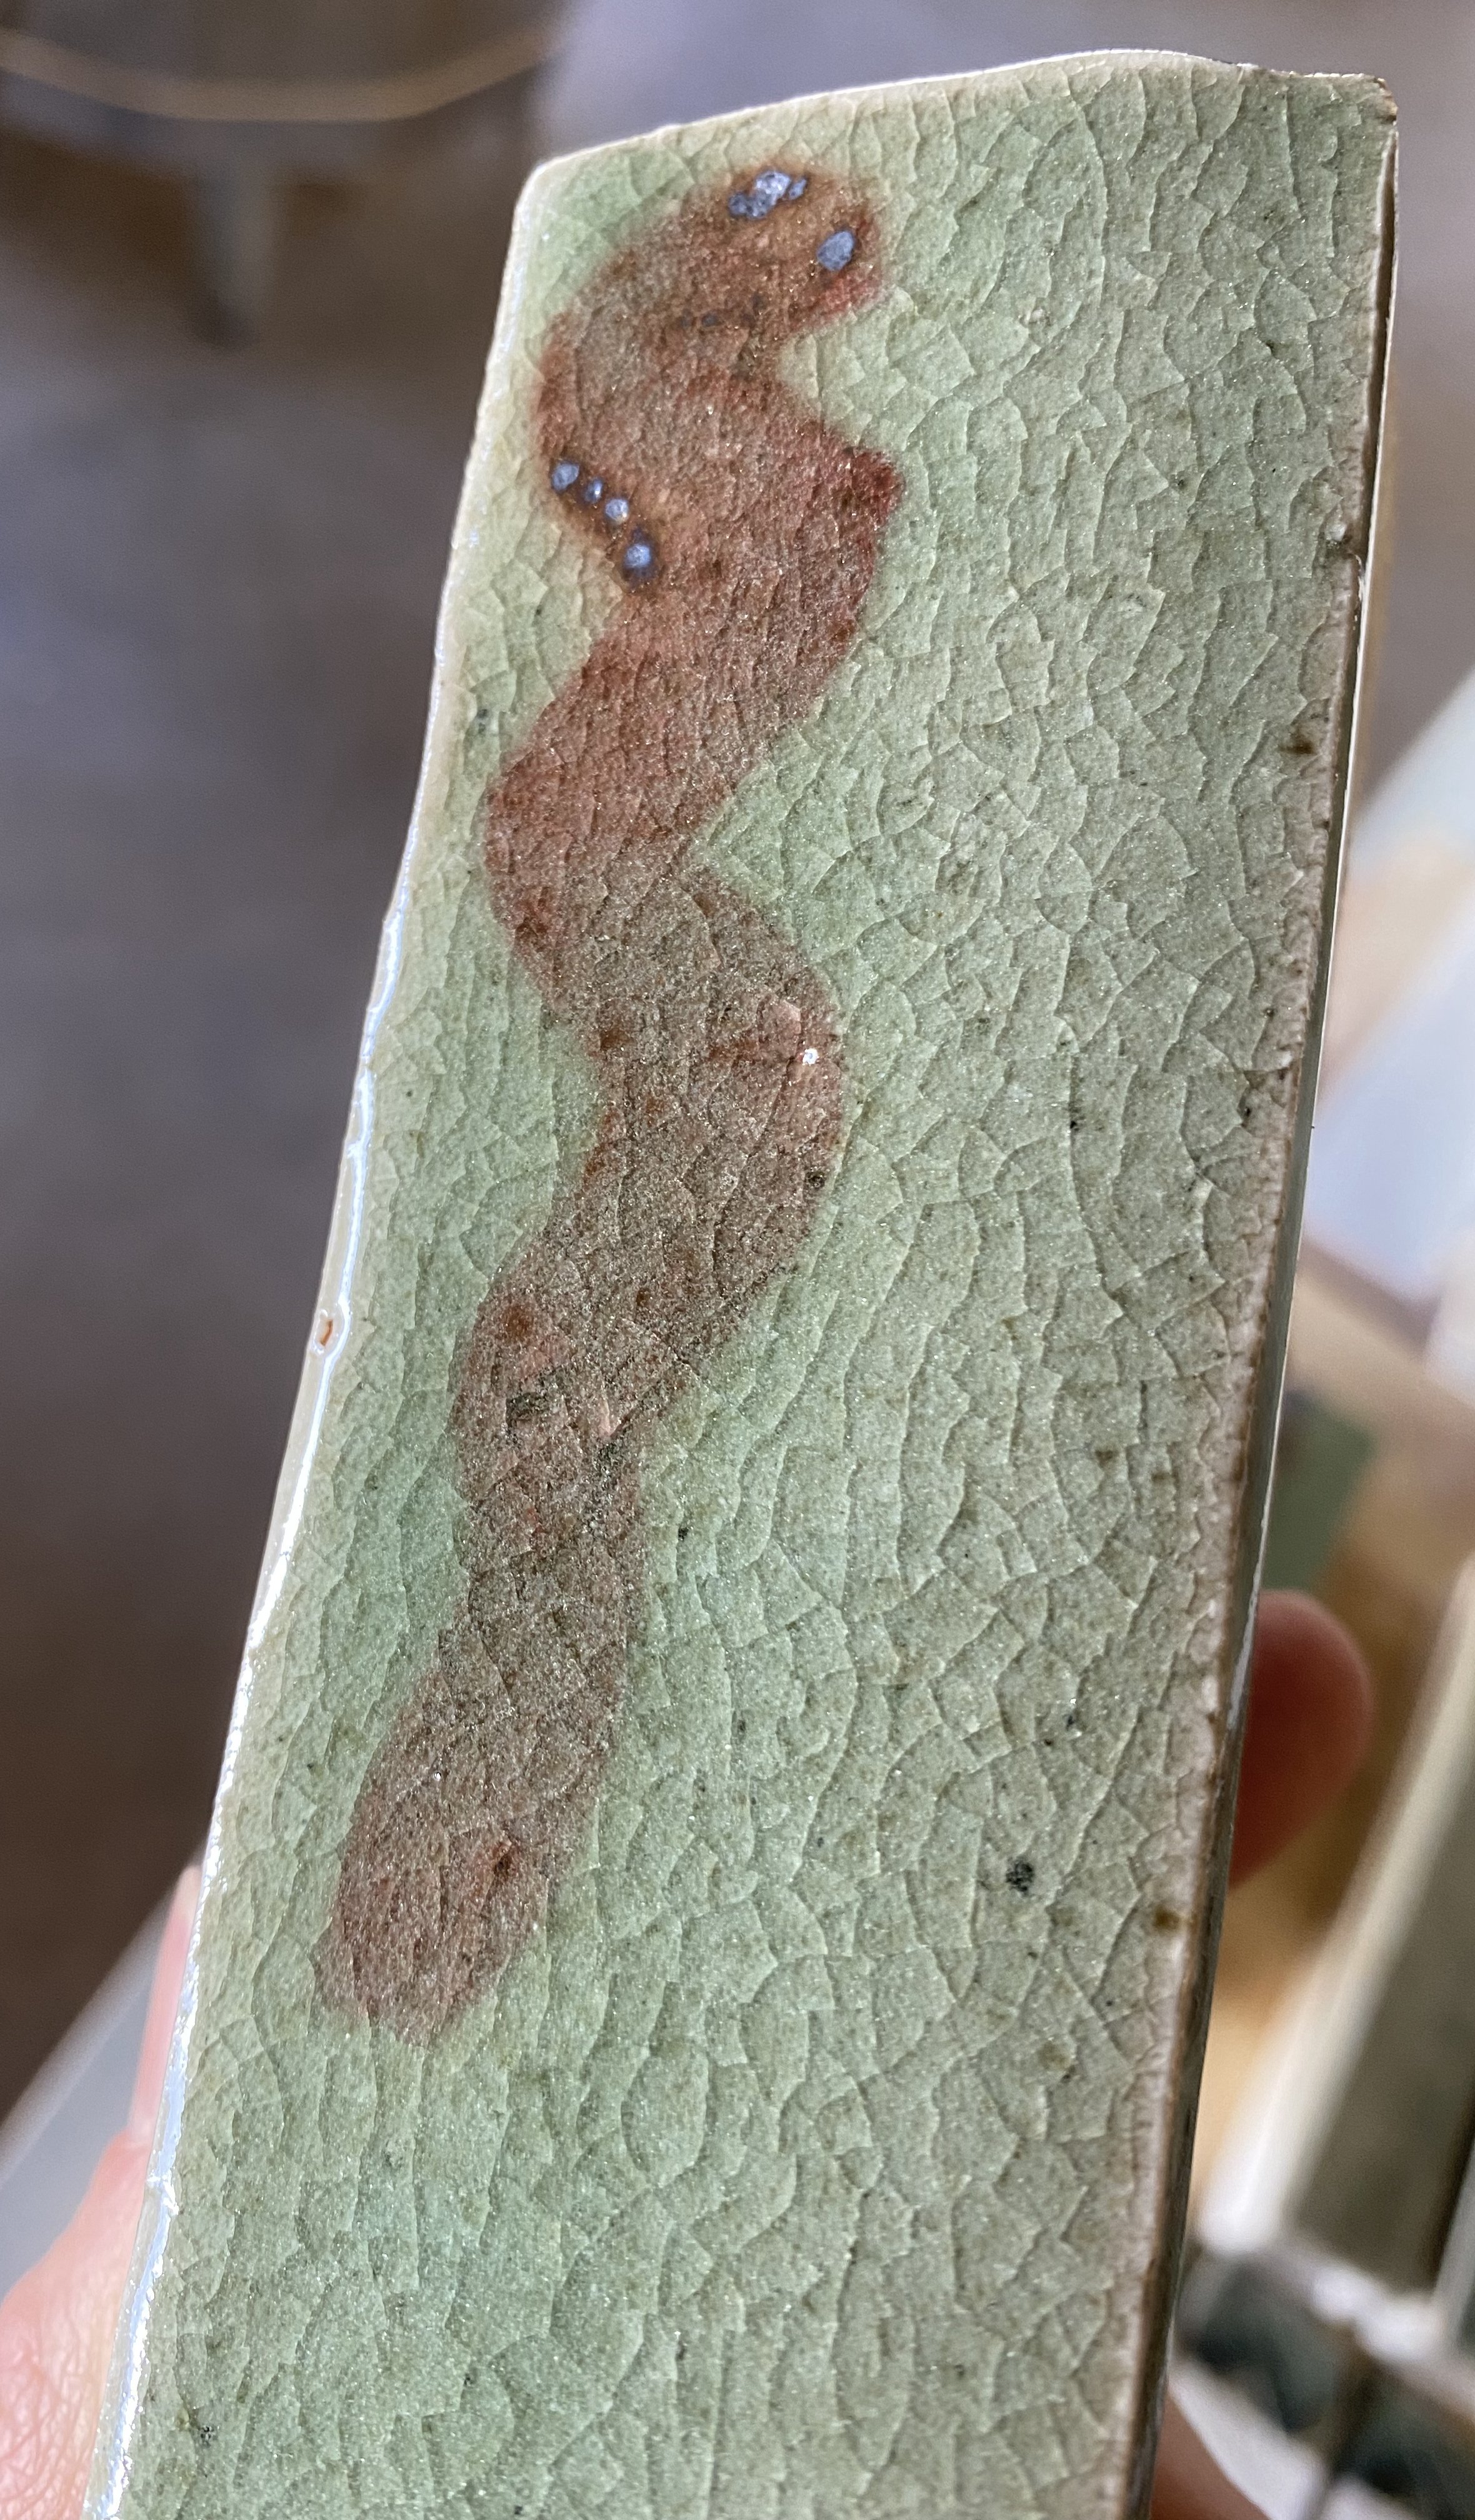
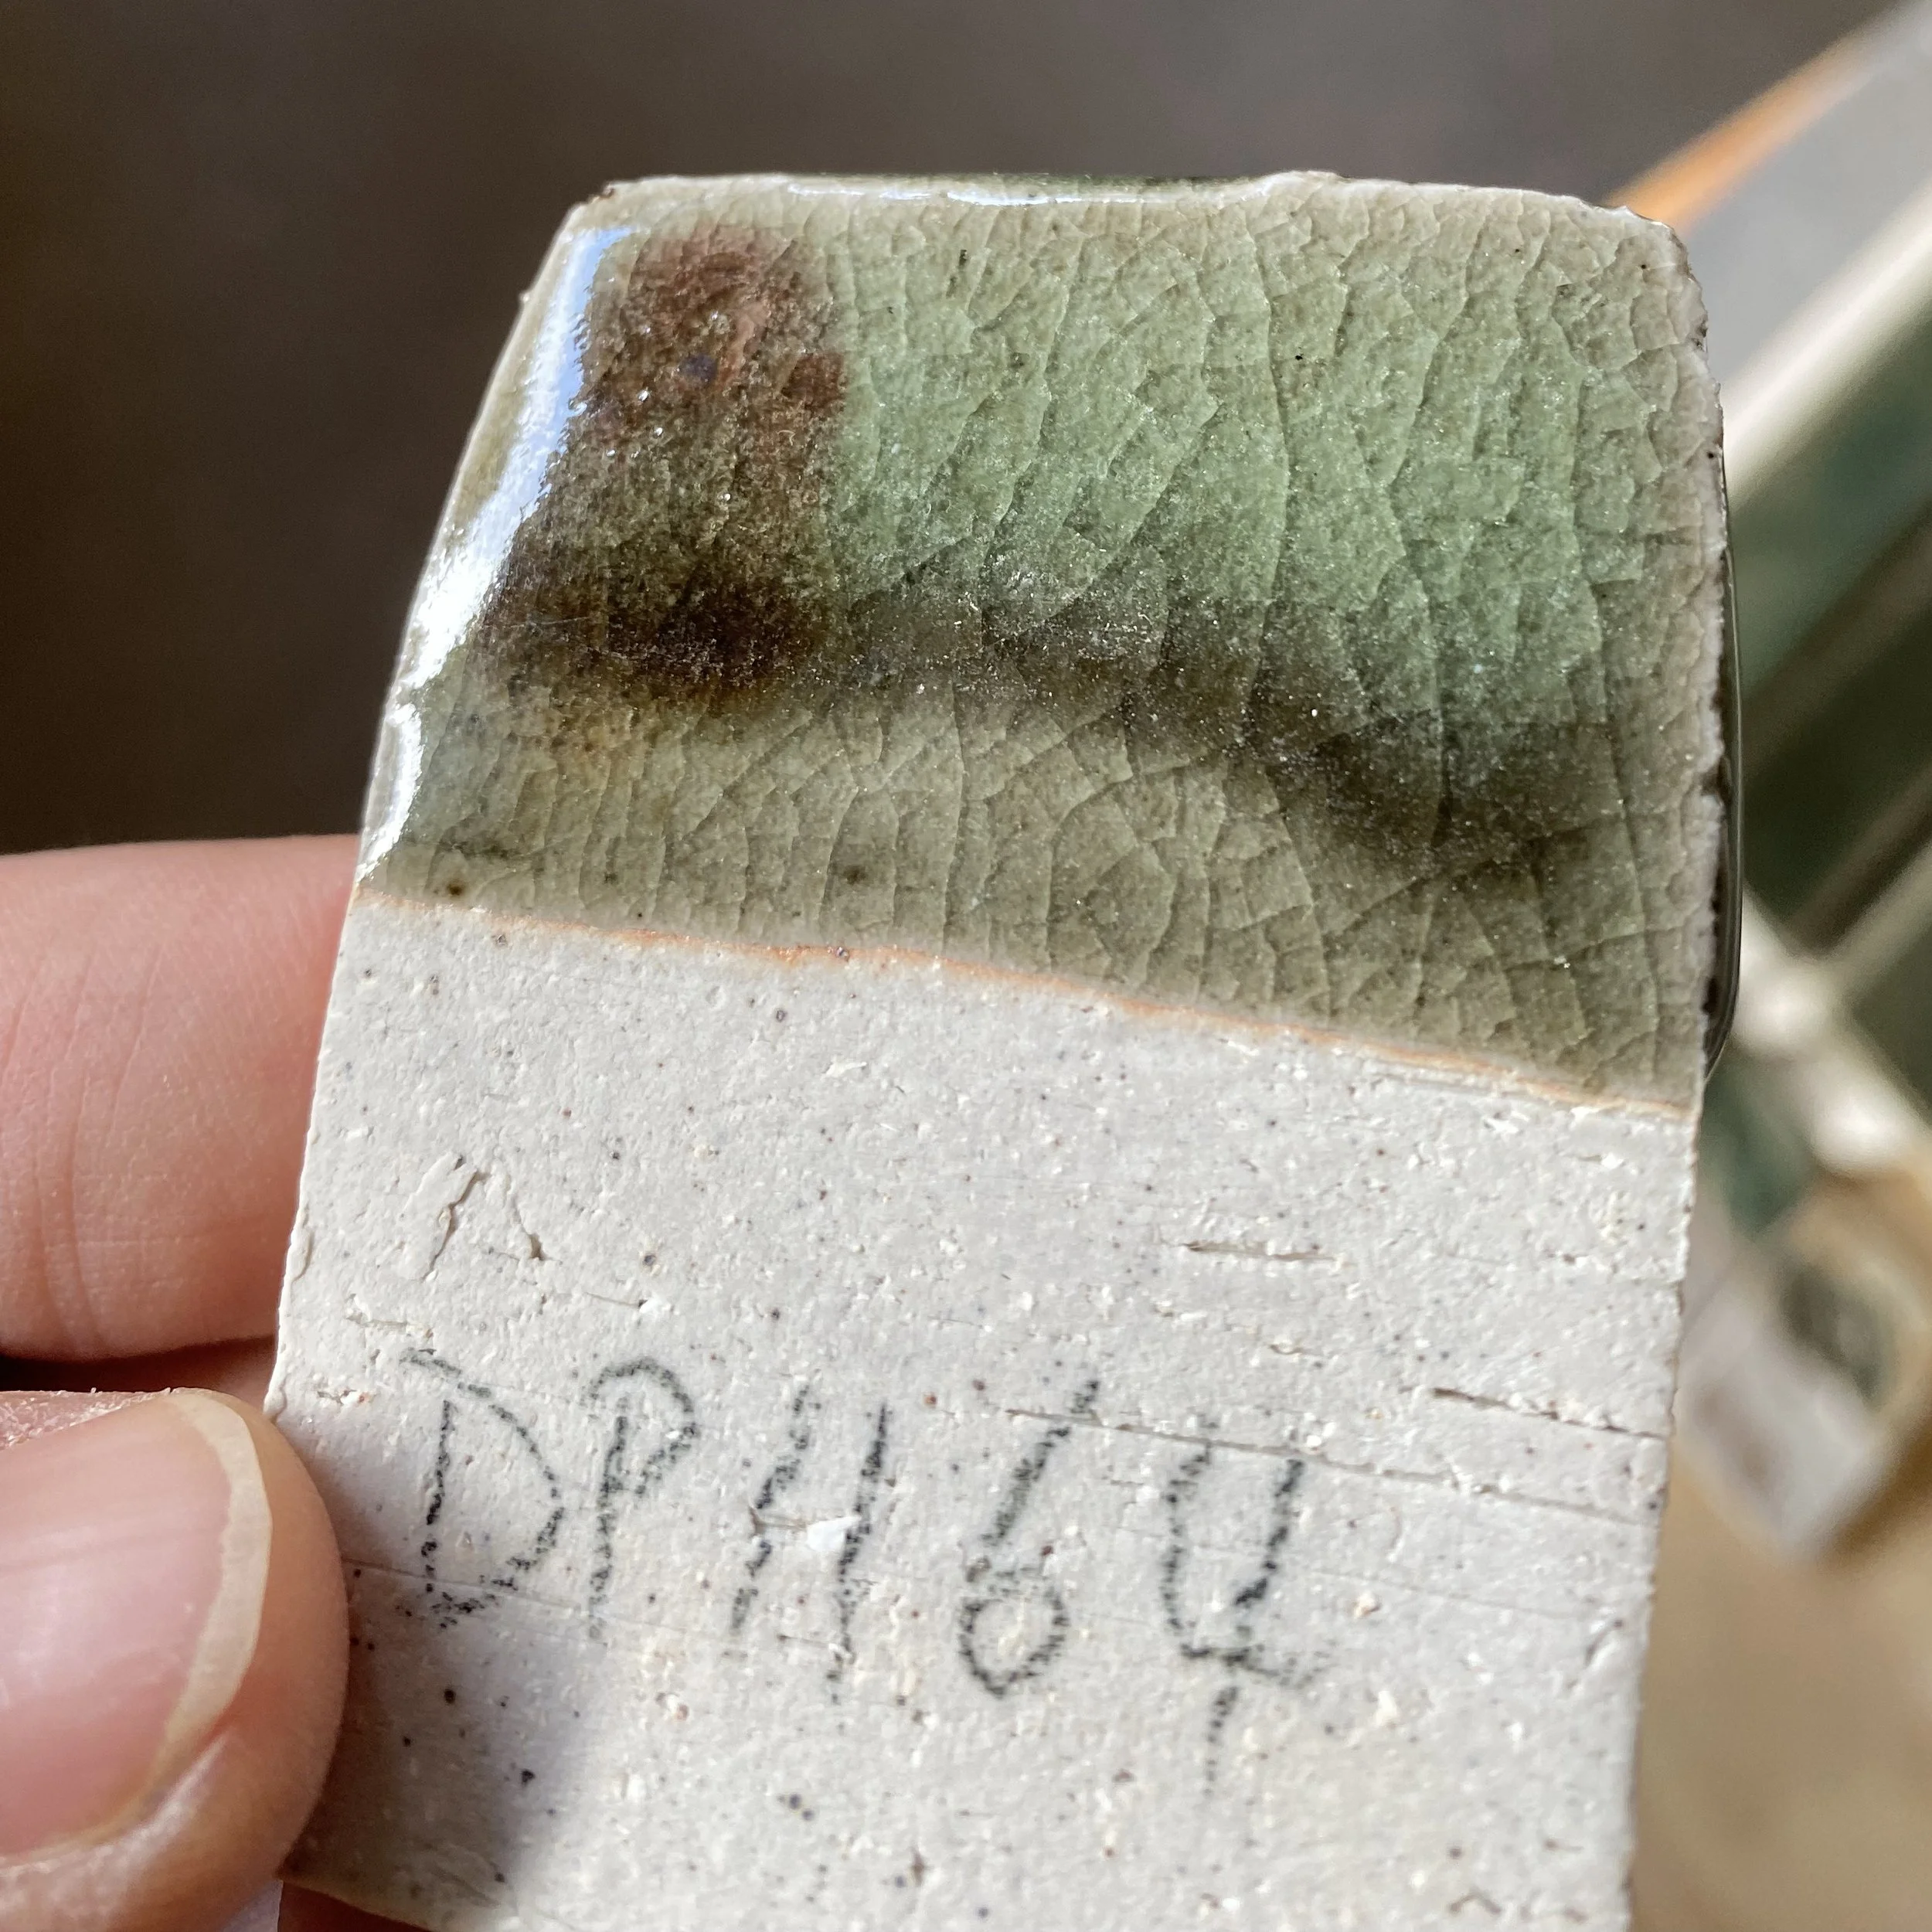
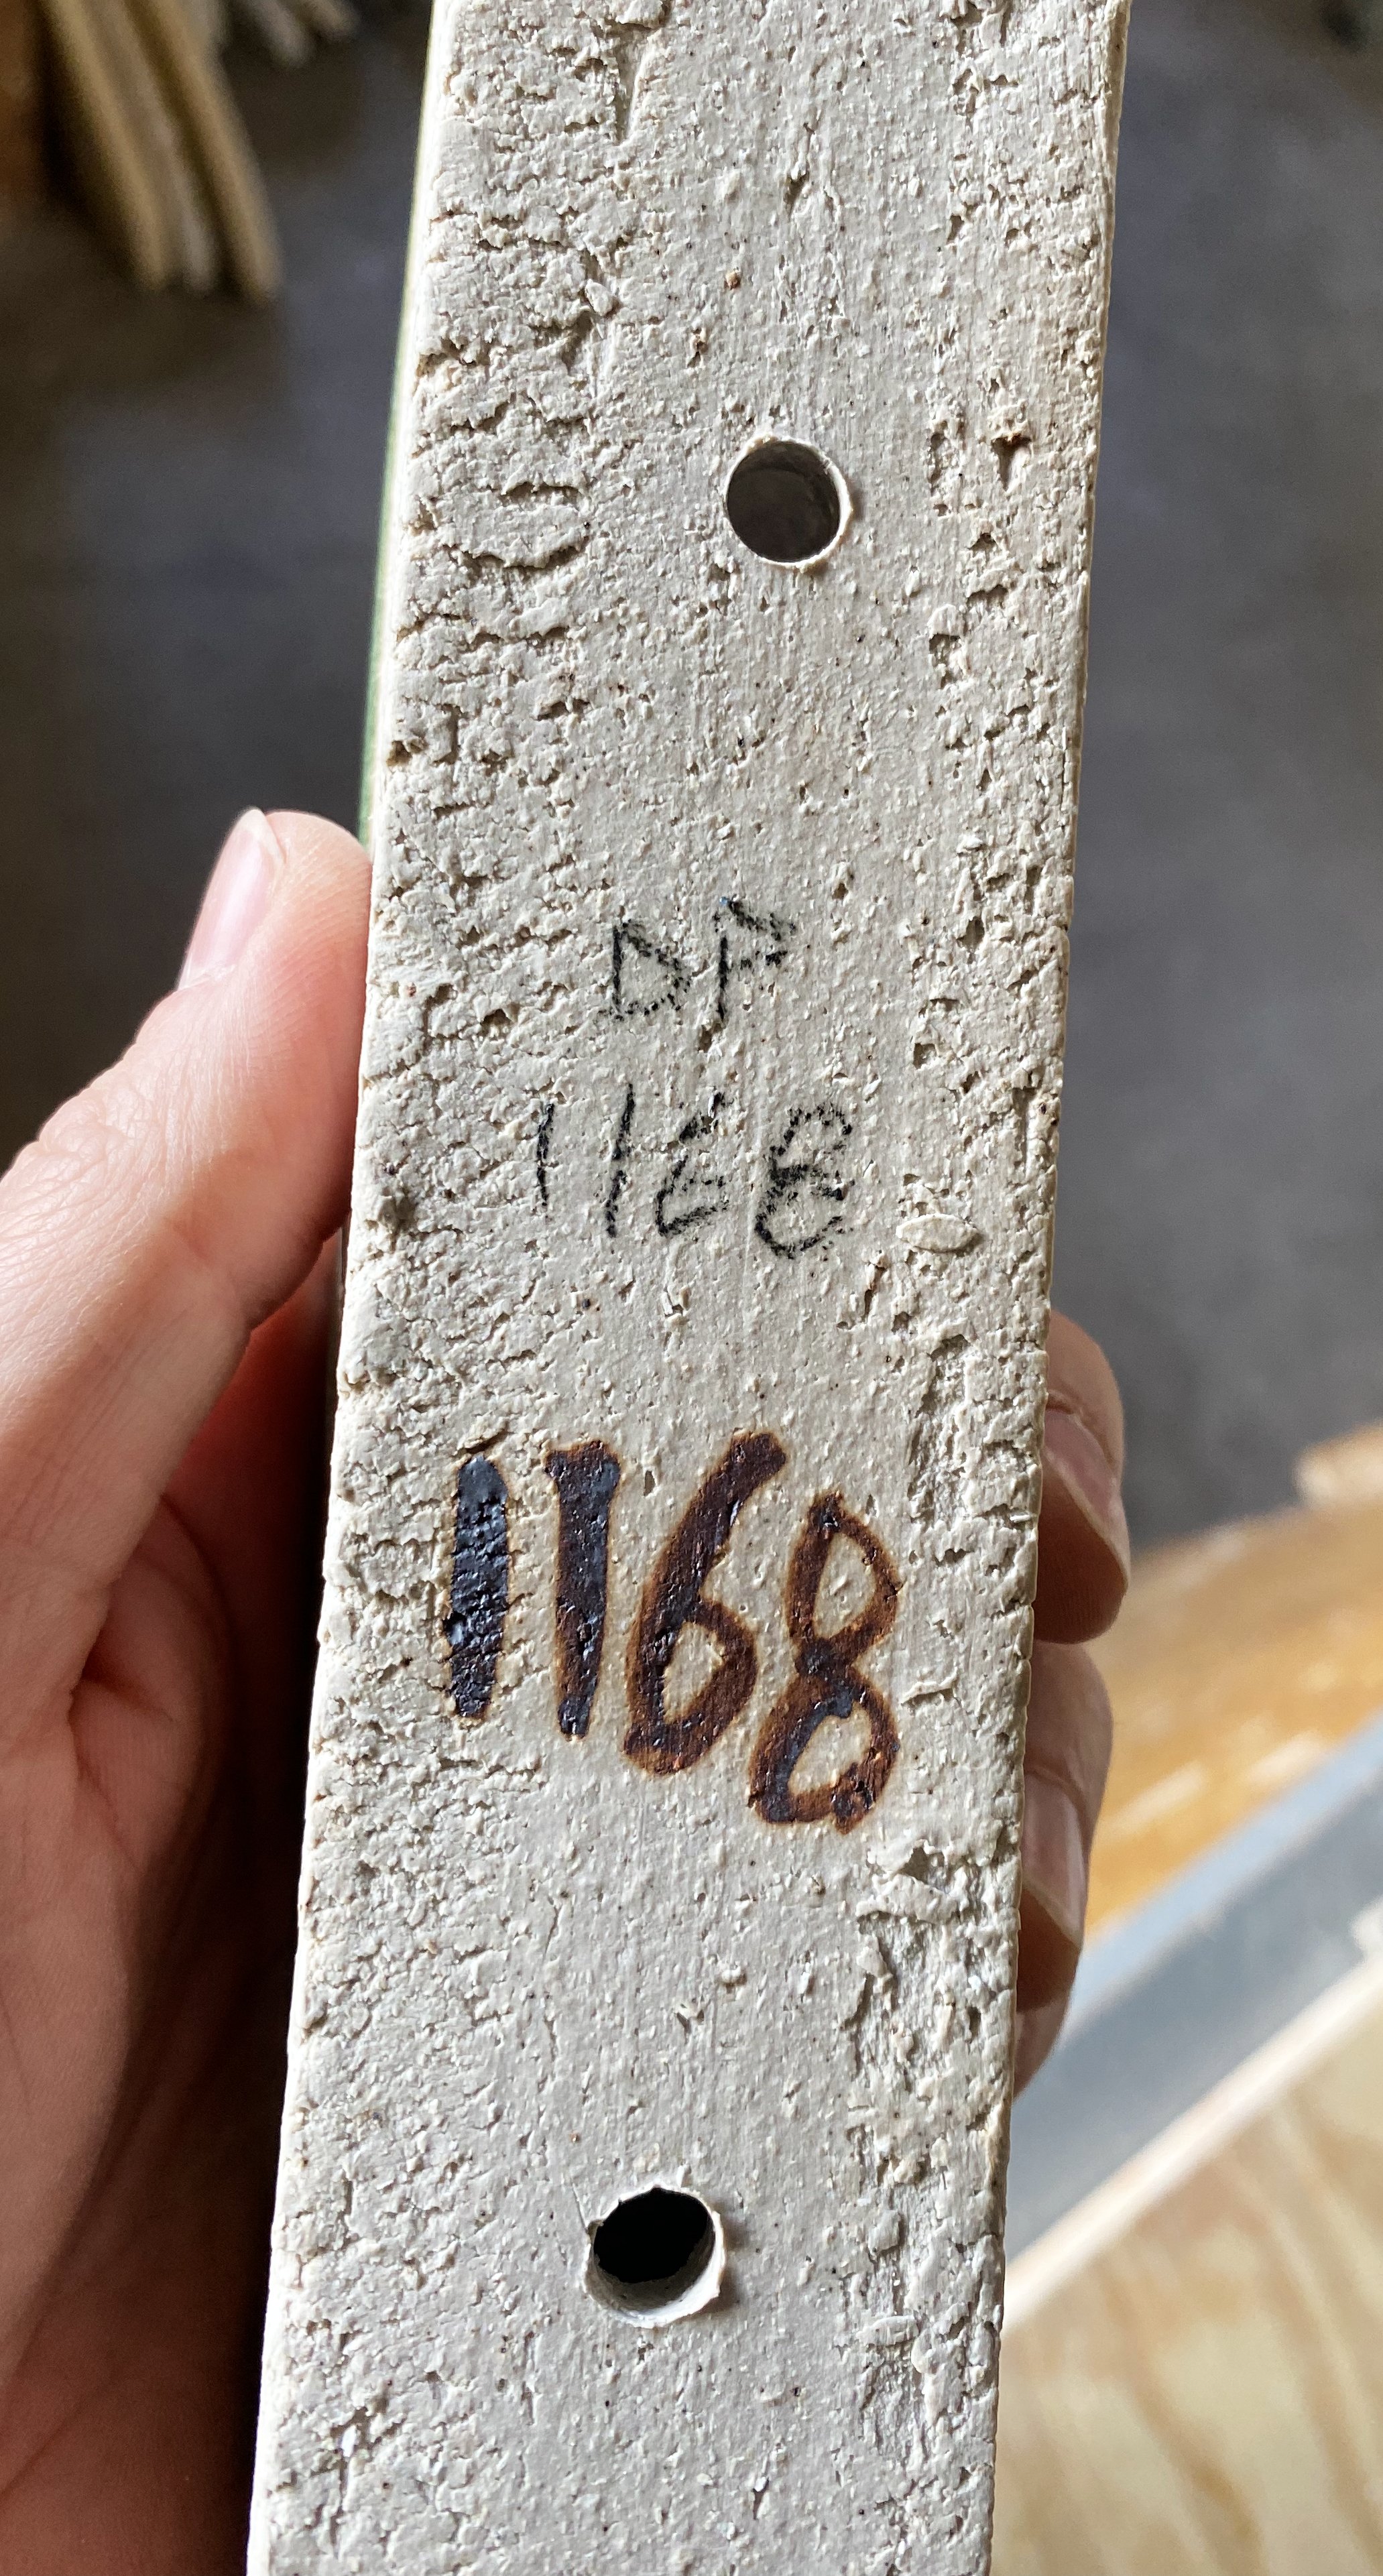
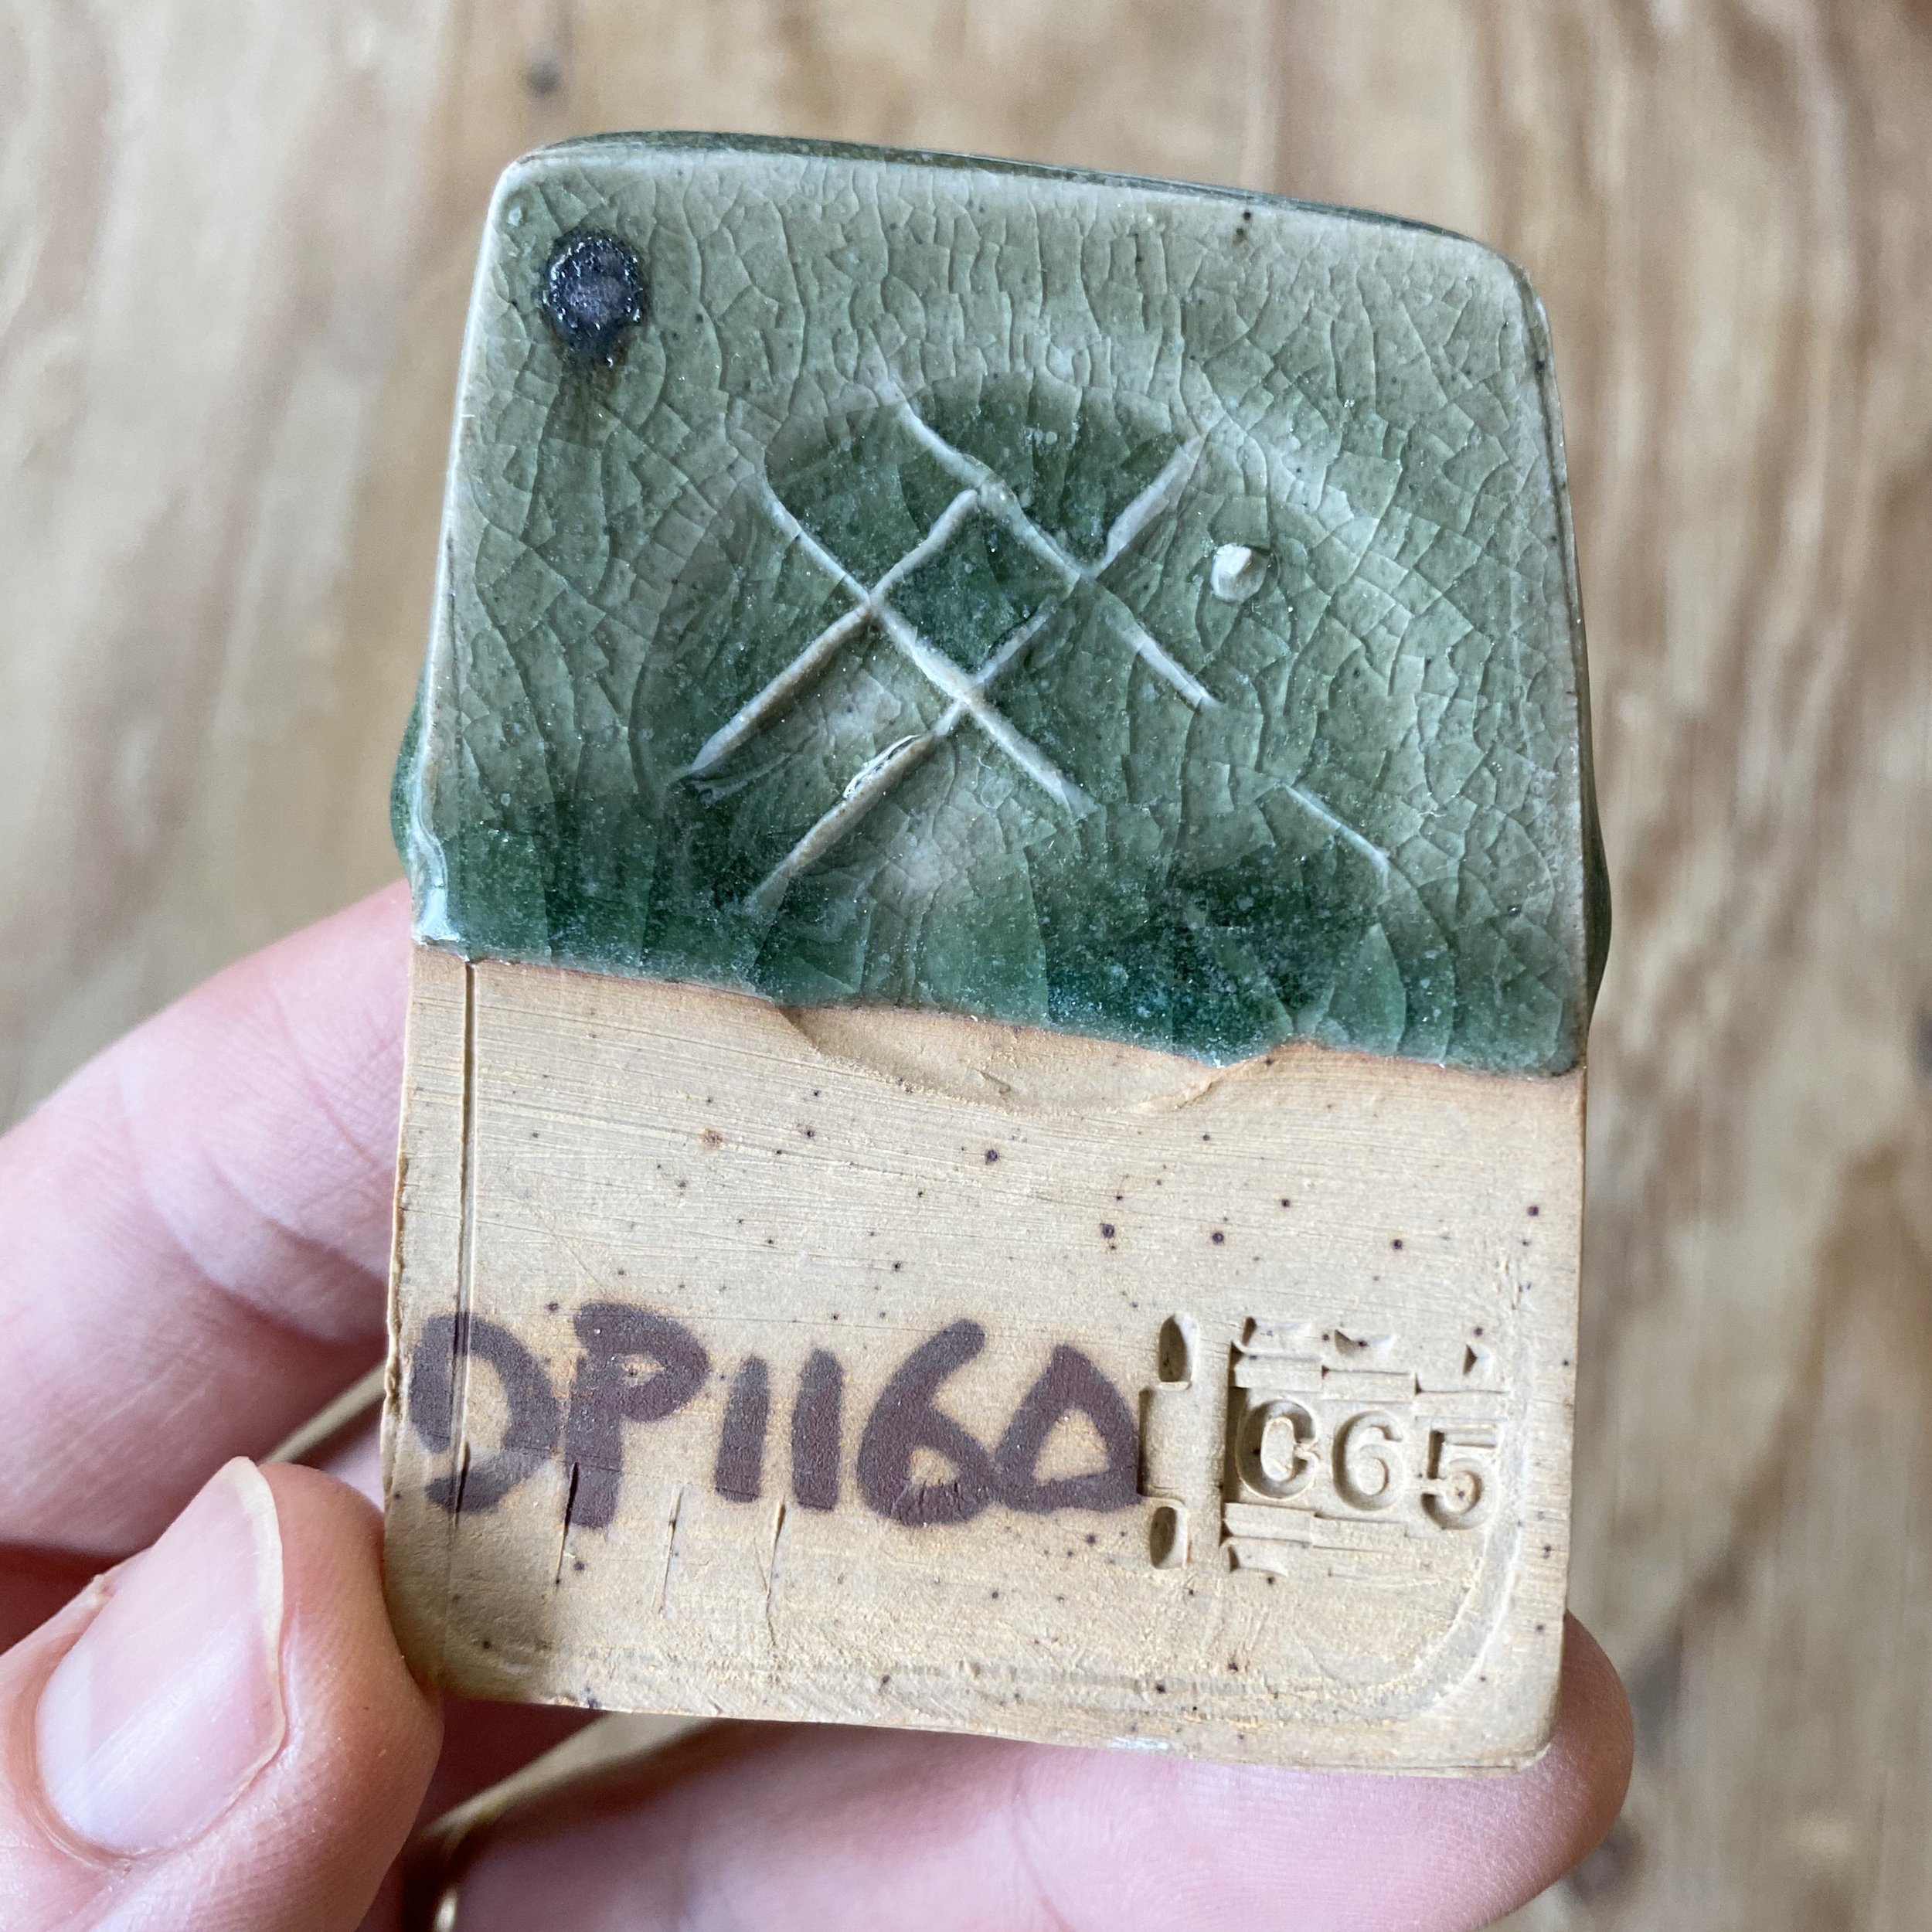
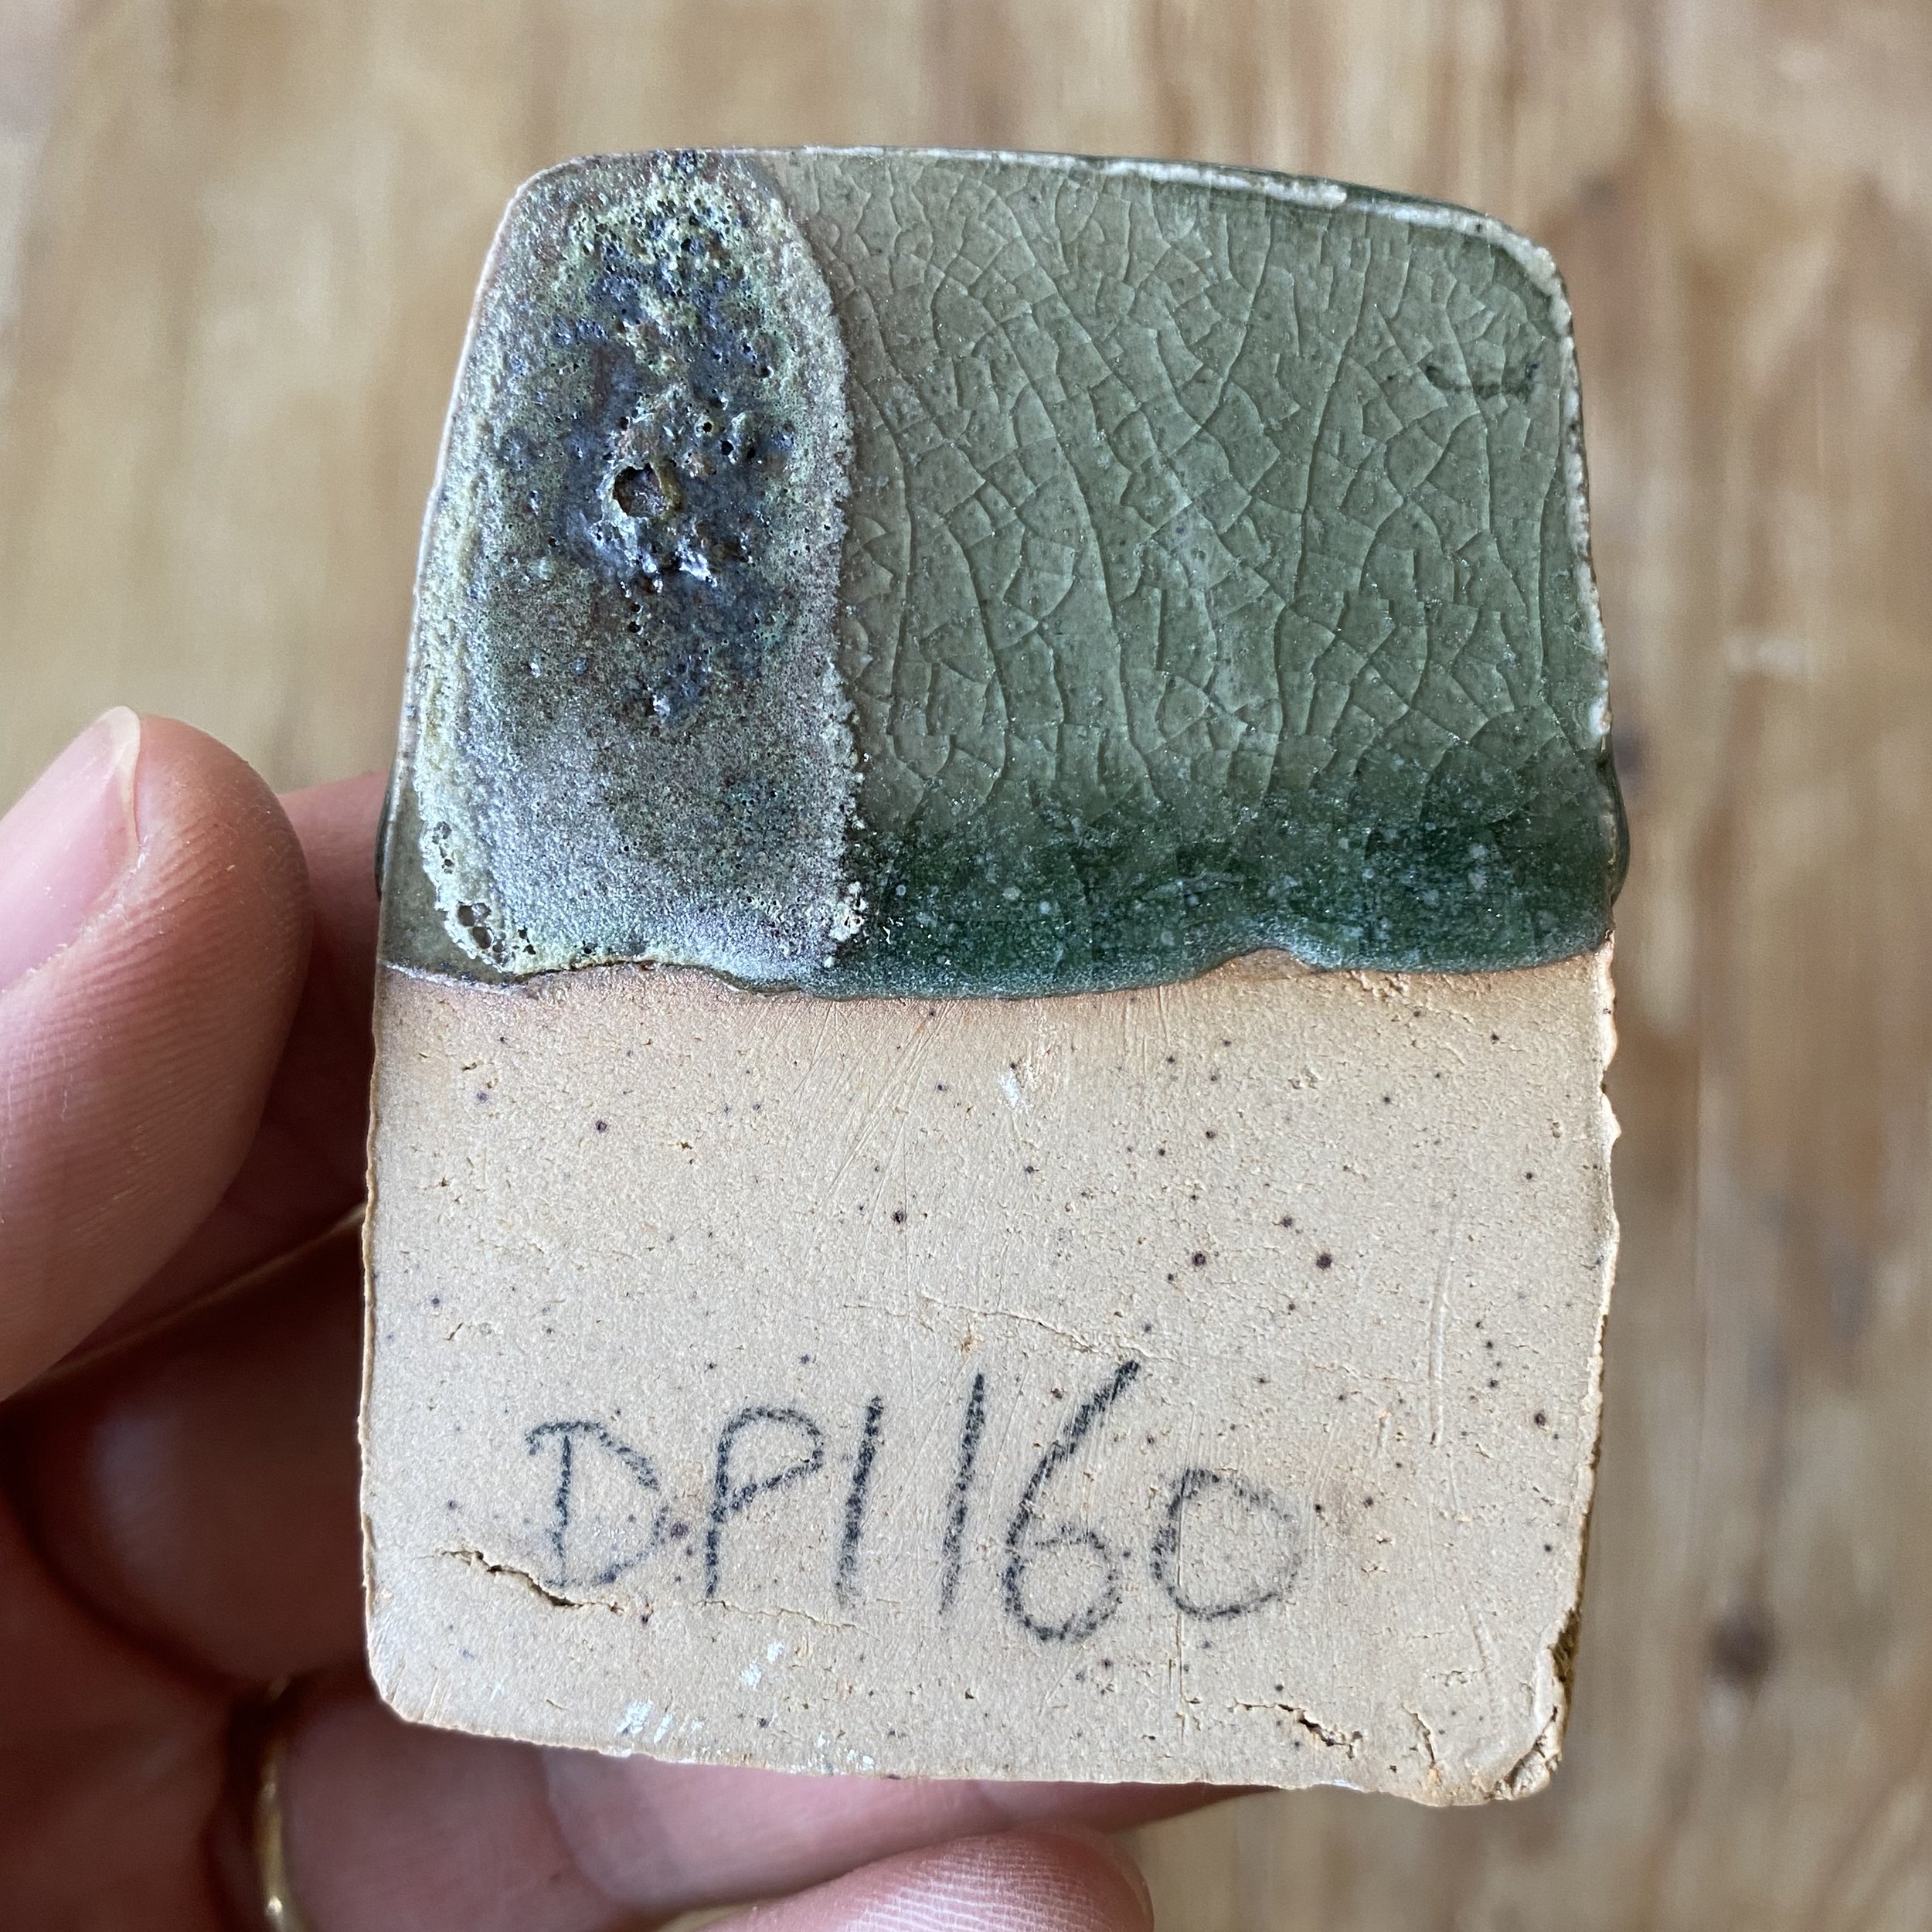
DP1160 (you can see the chun effect starting a little here where the glaze is thickest):
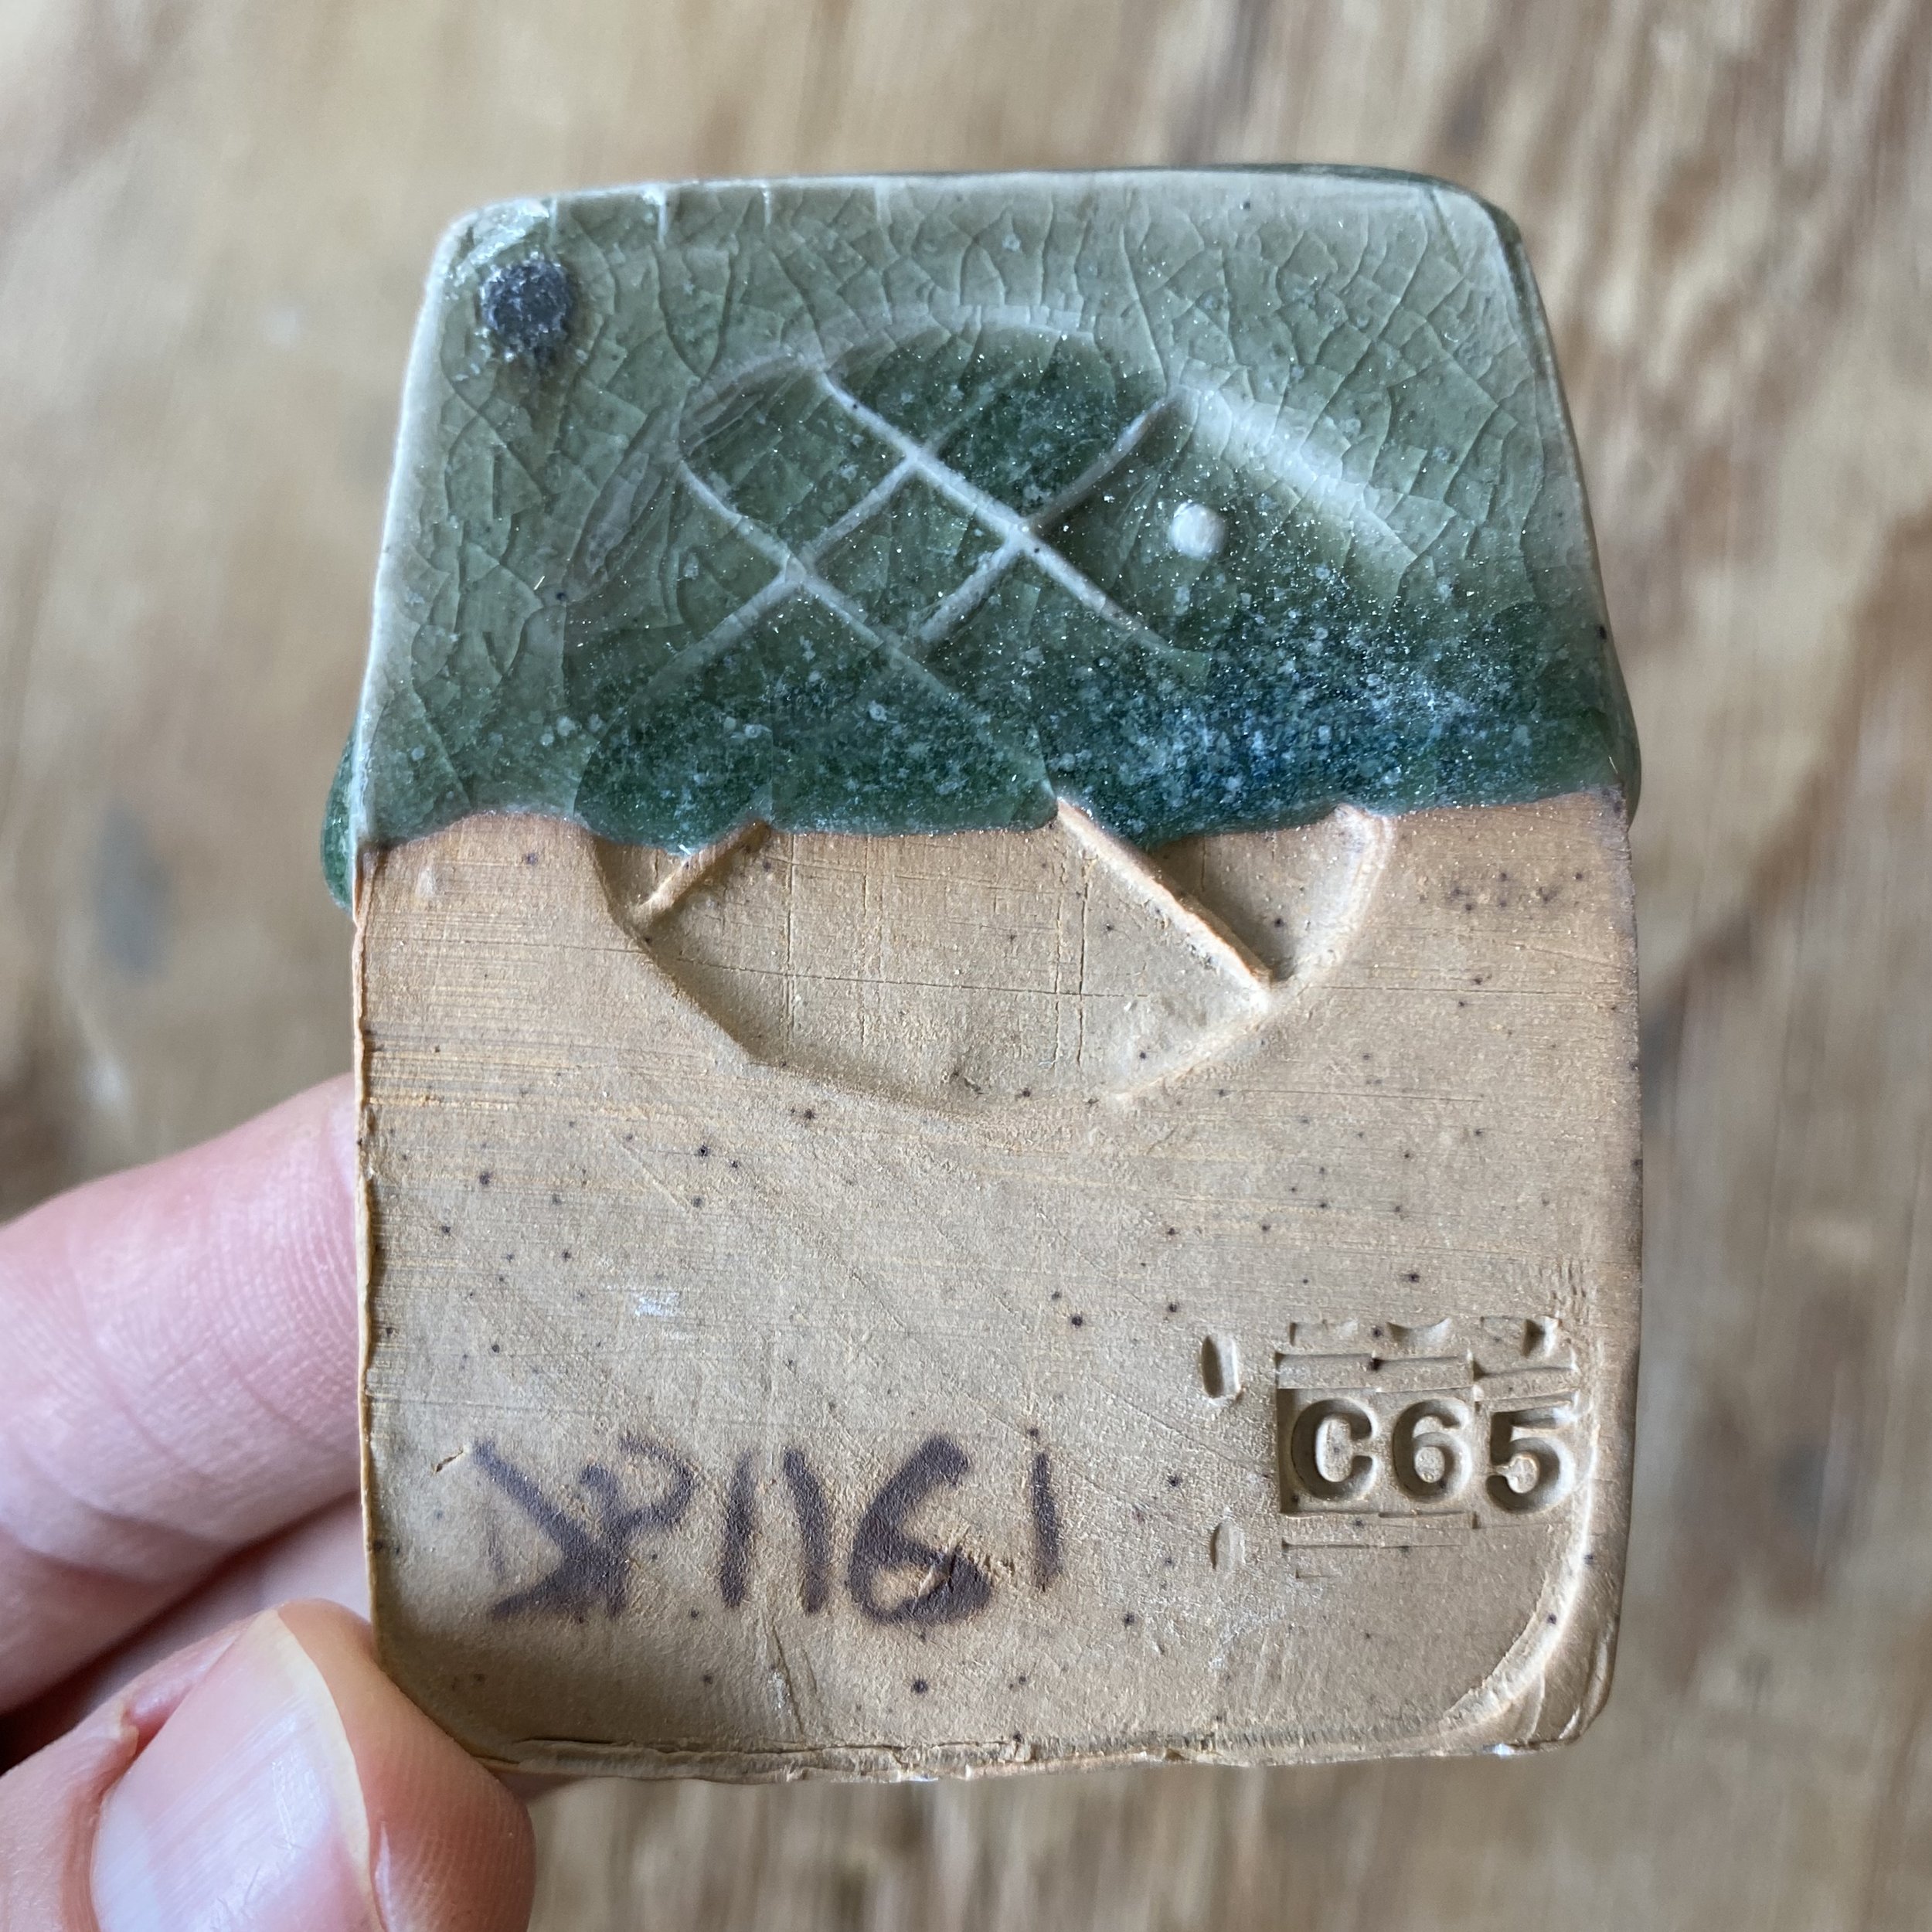
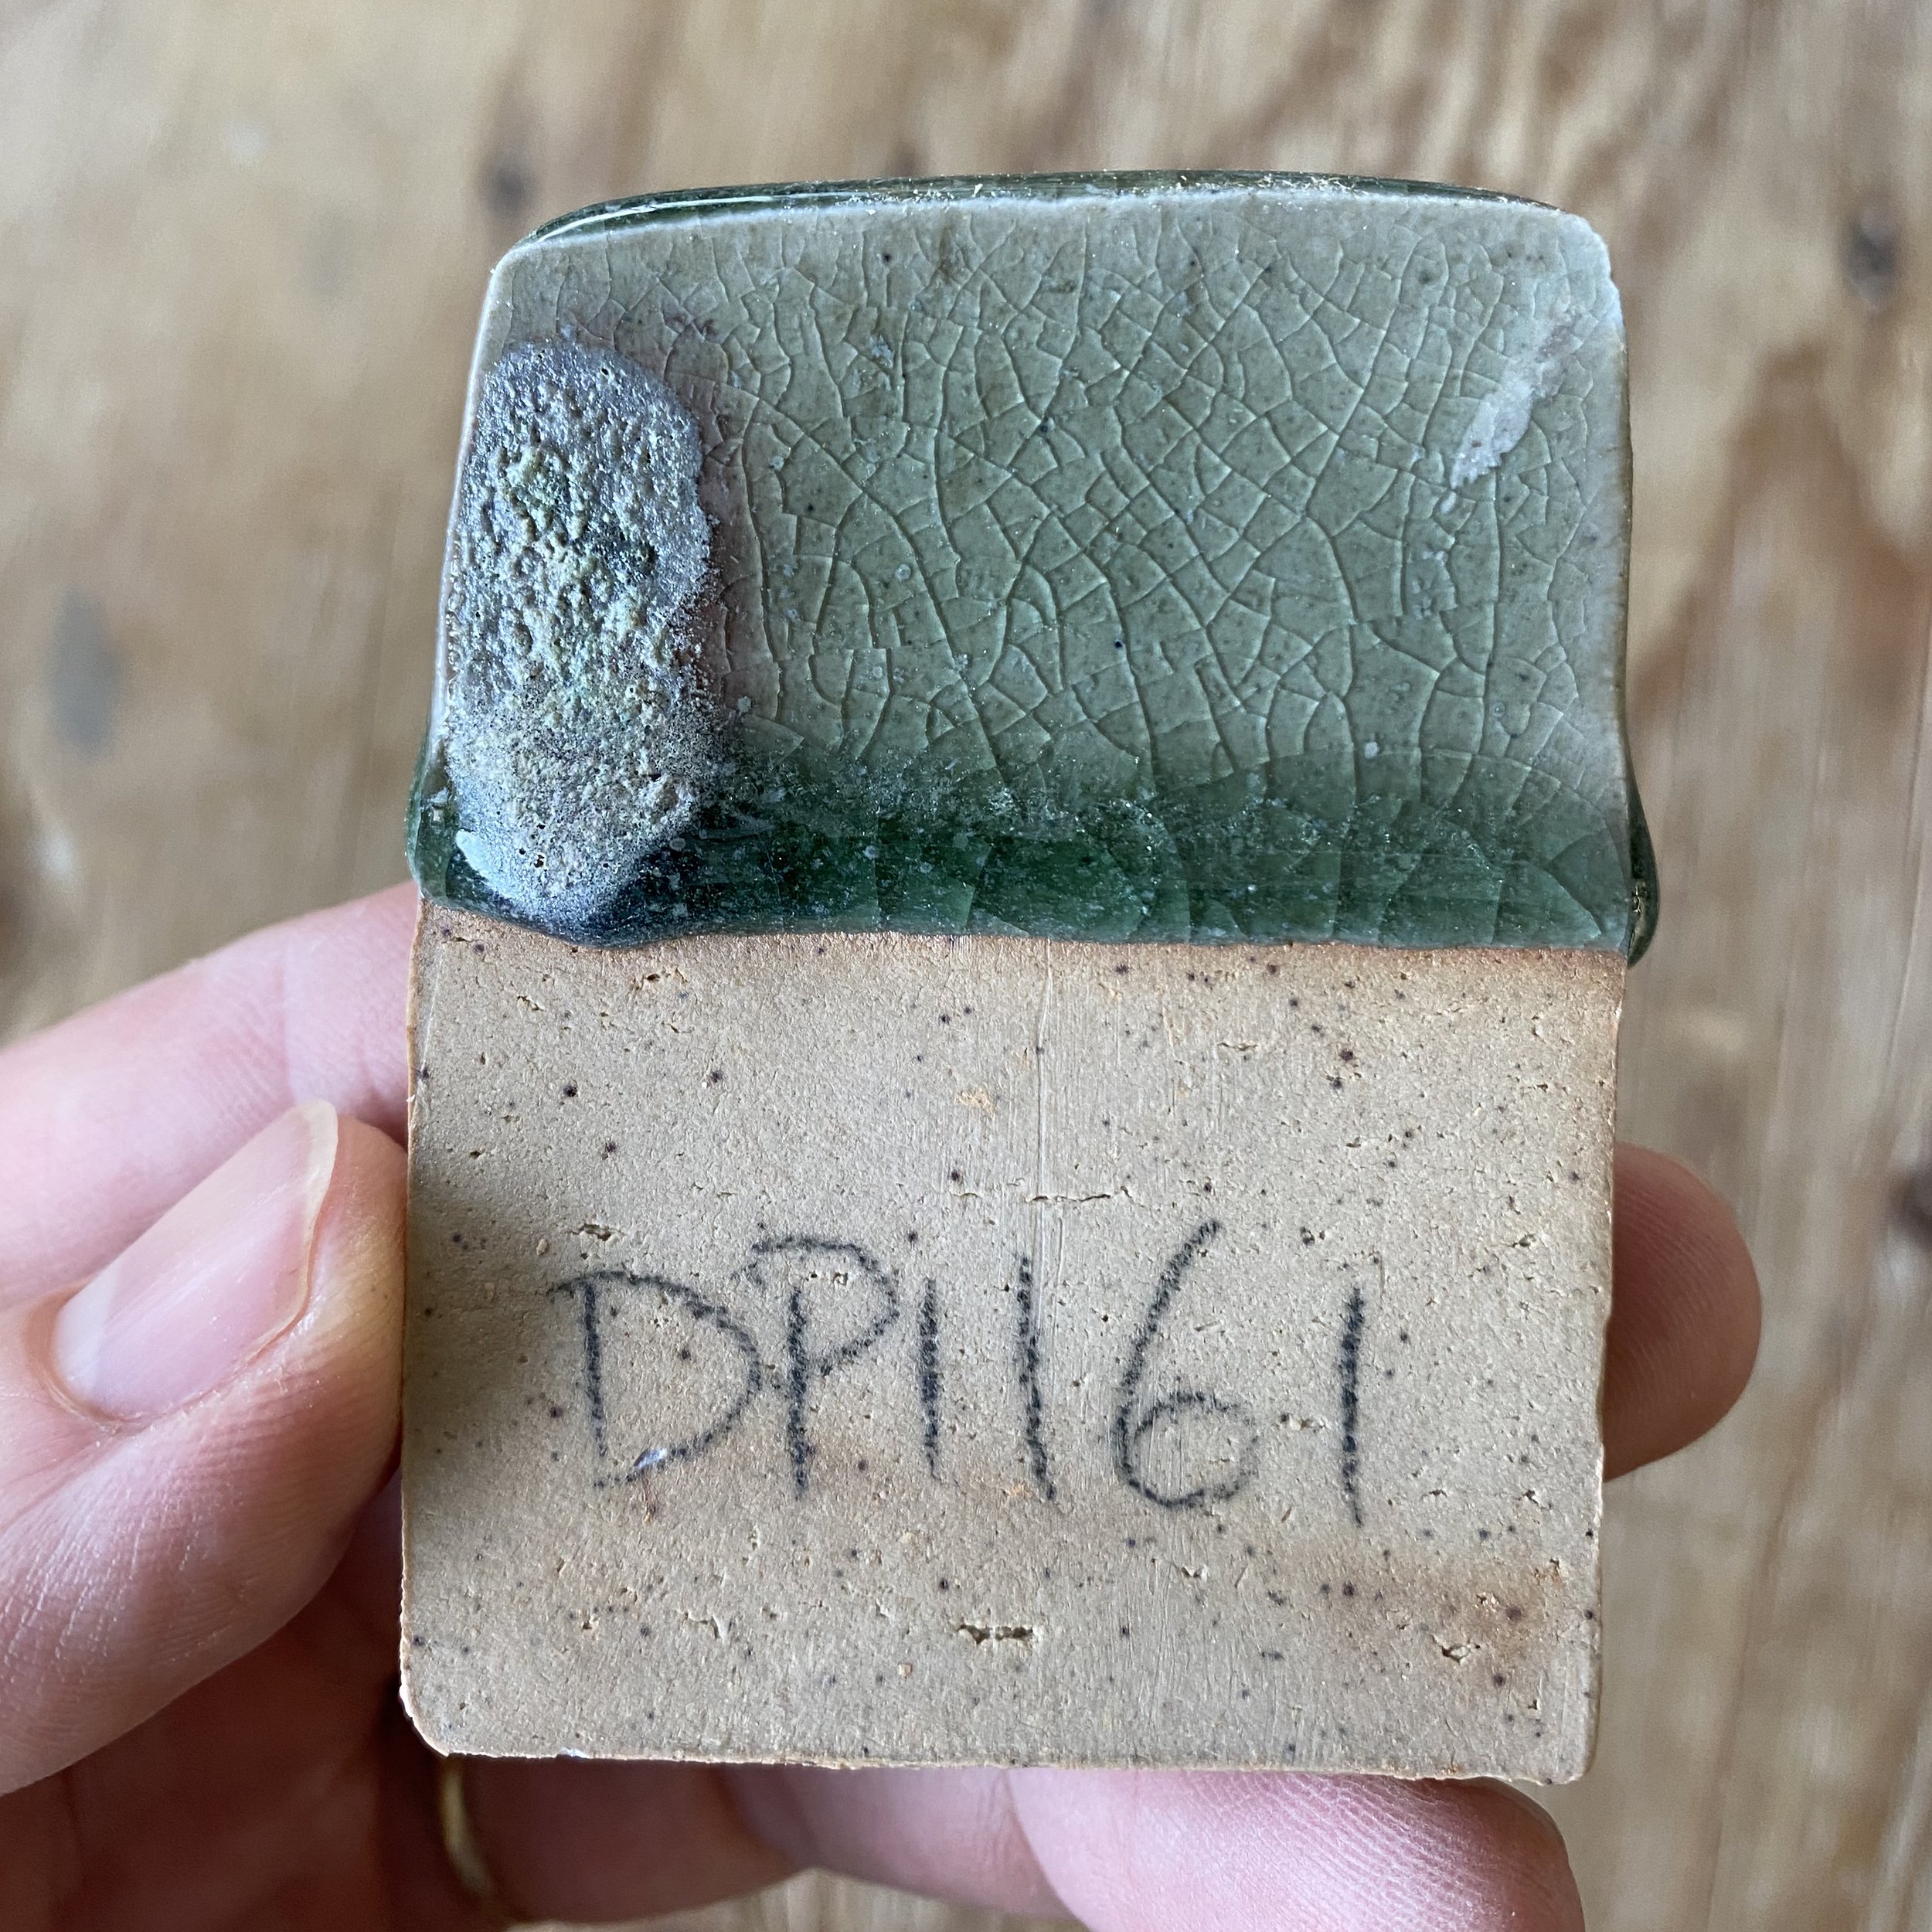
DP1161:
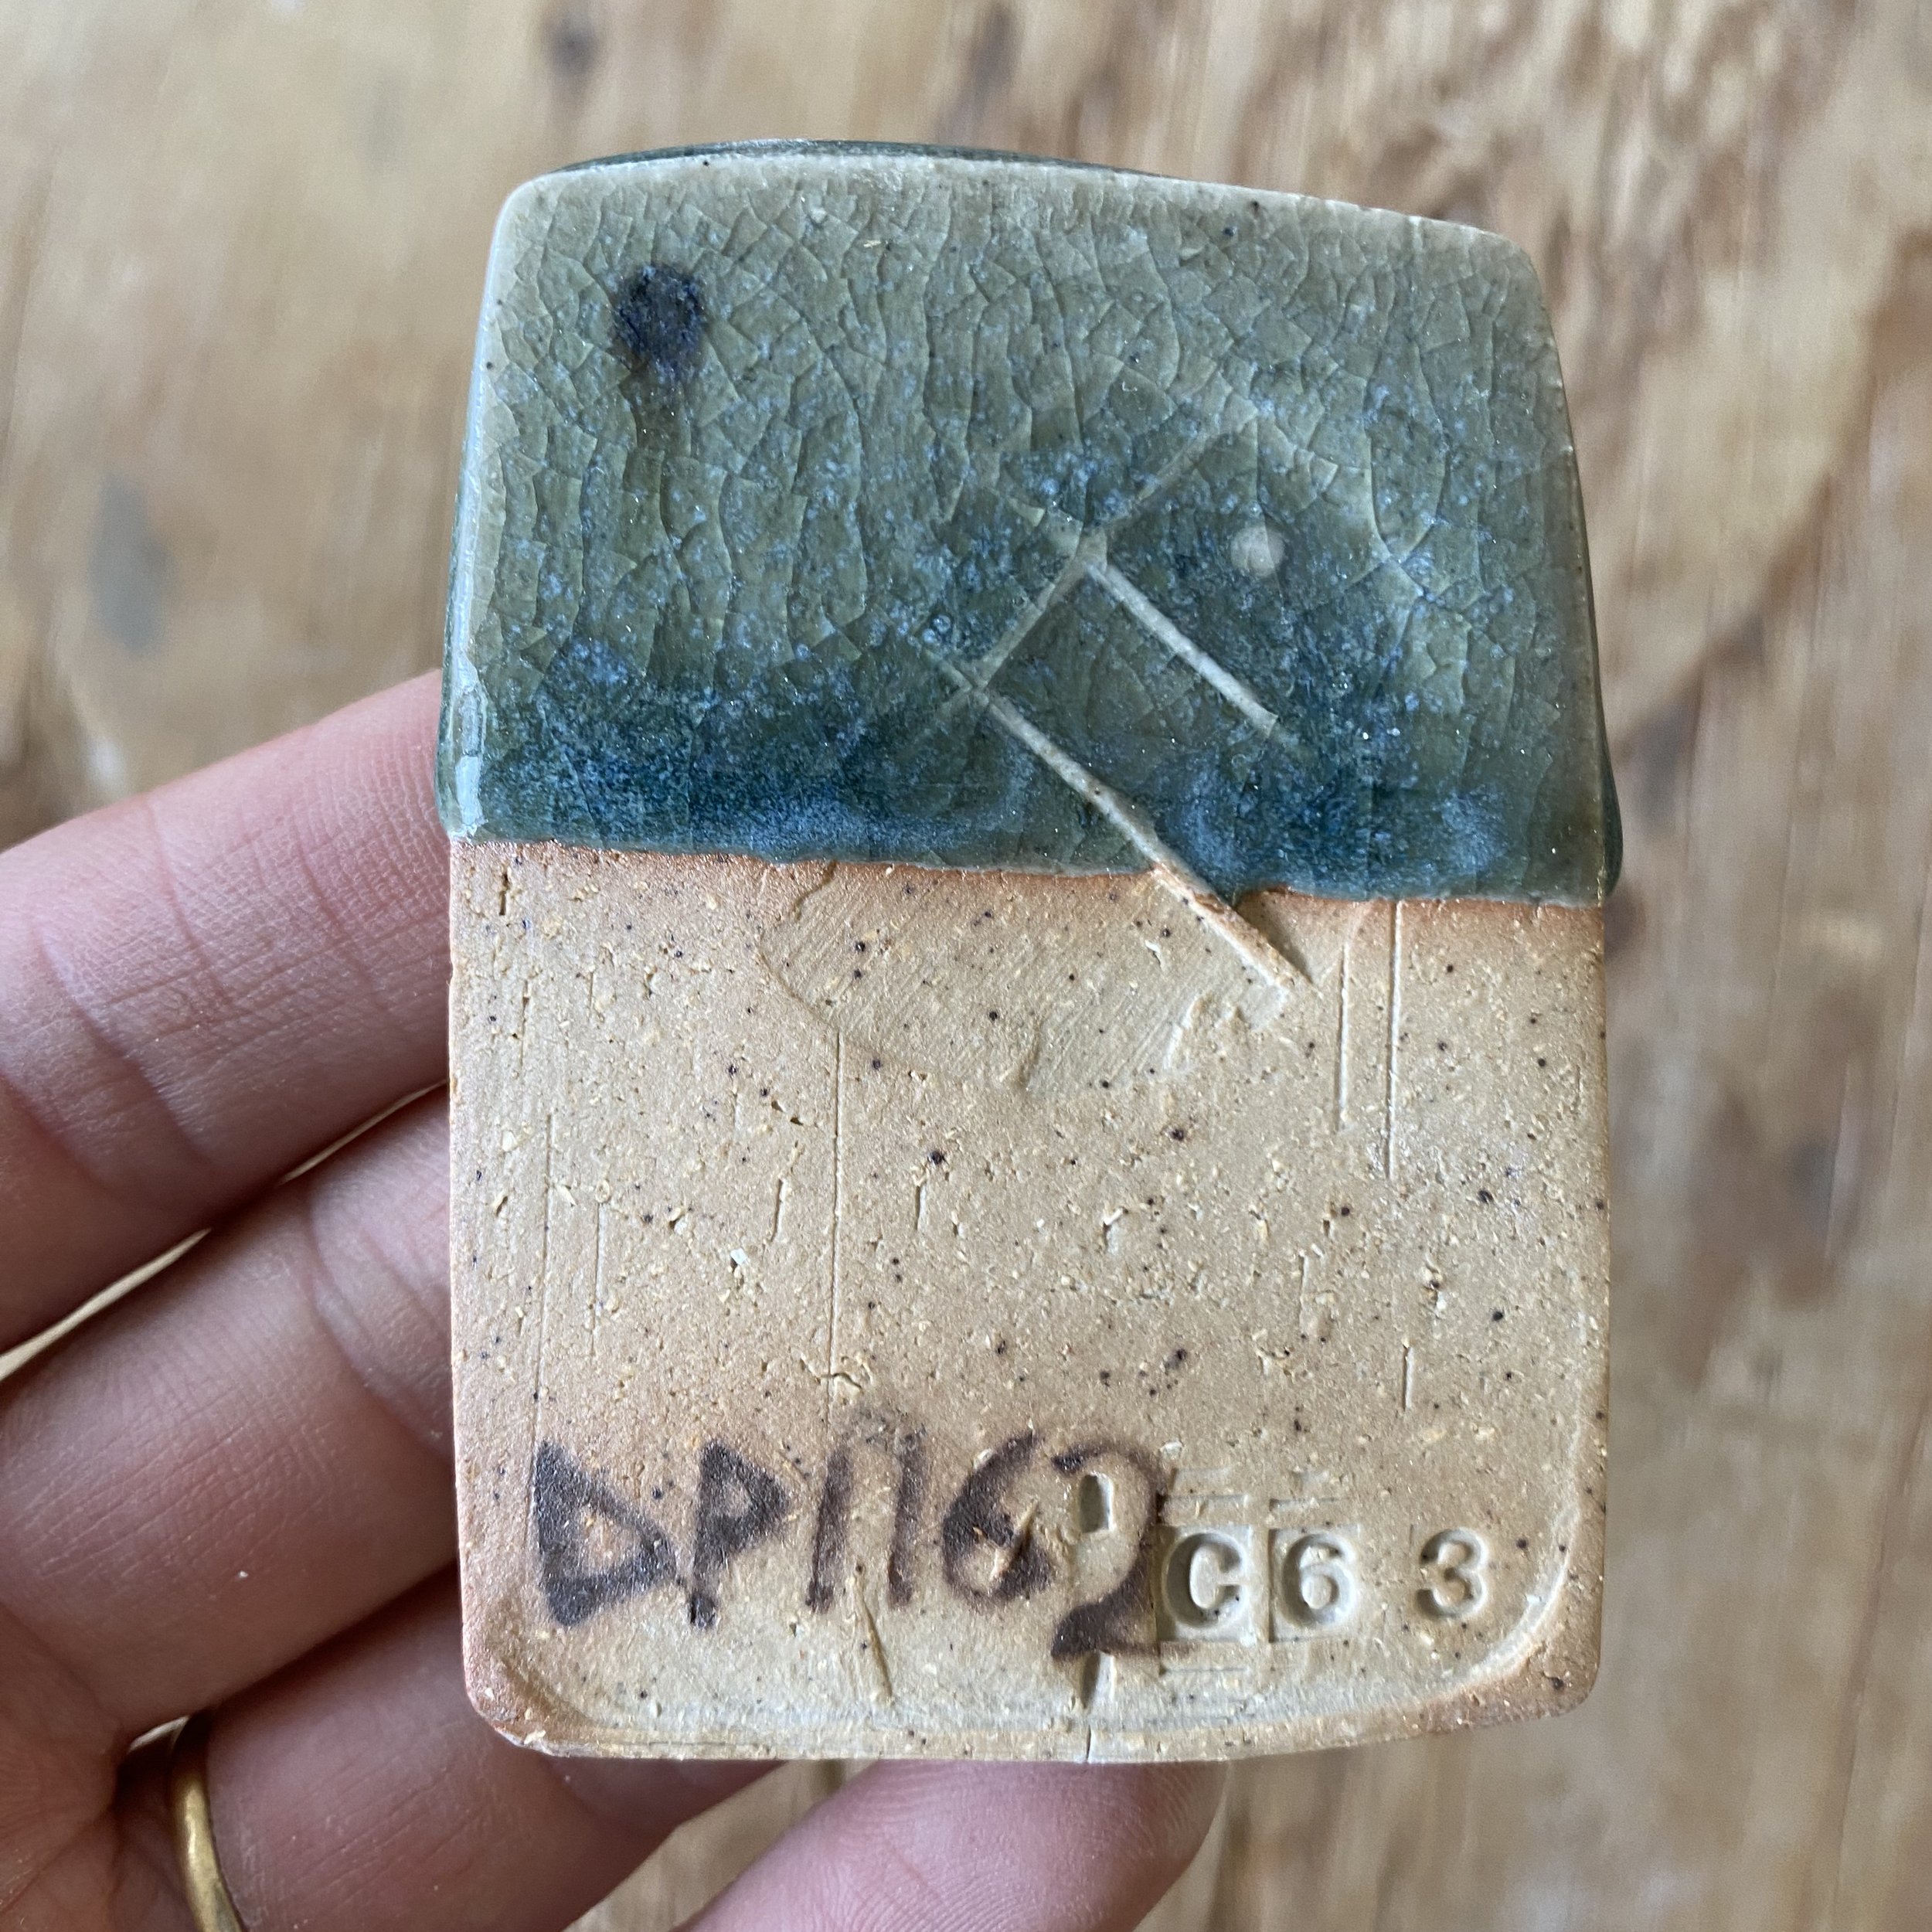
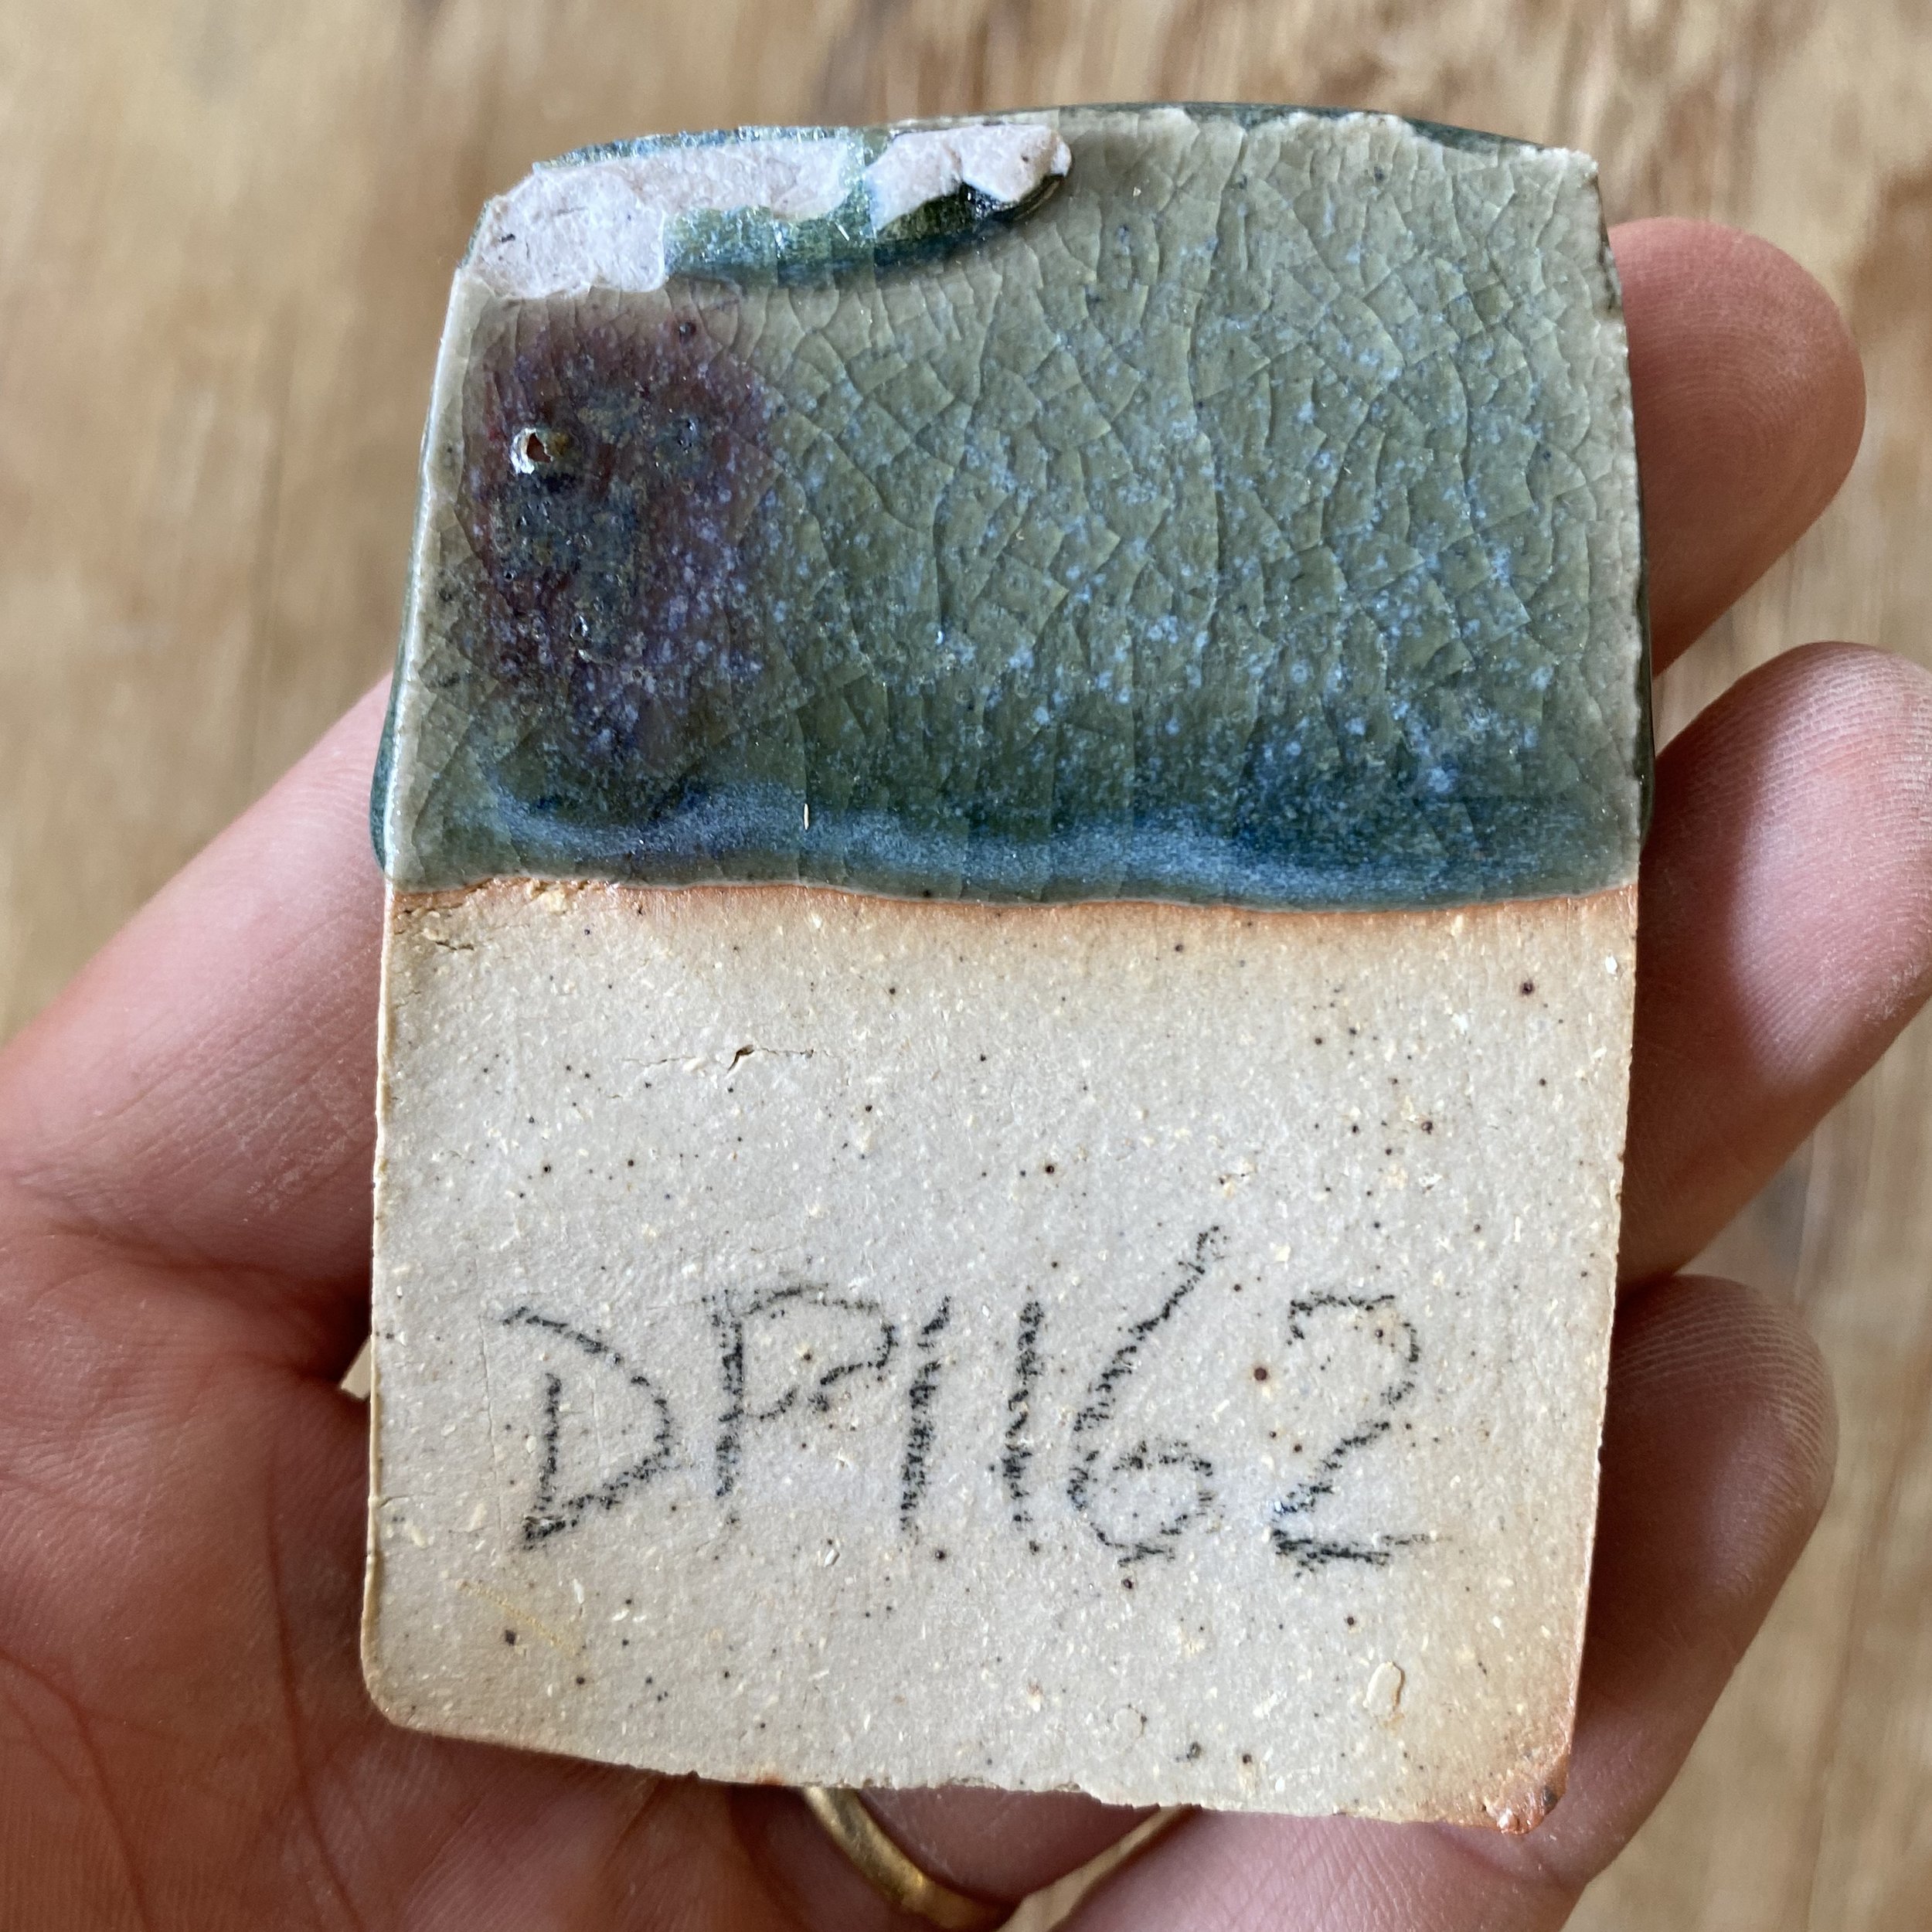
DP1162:
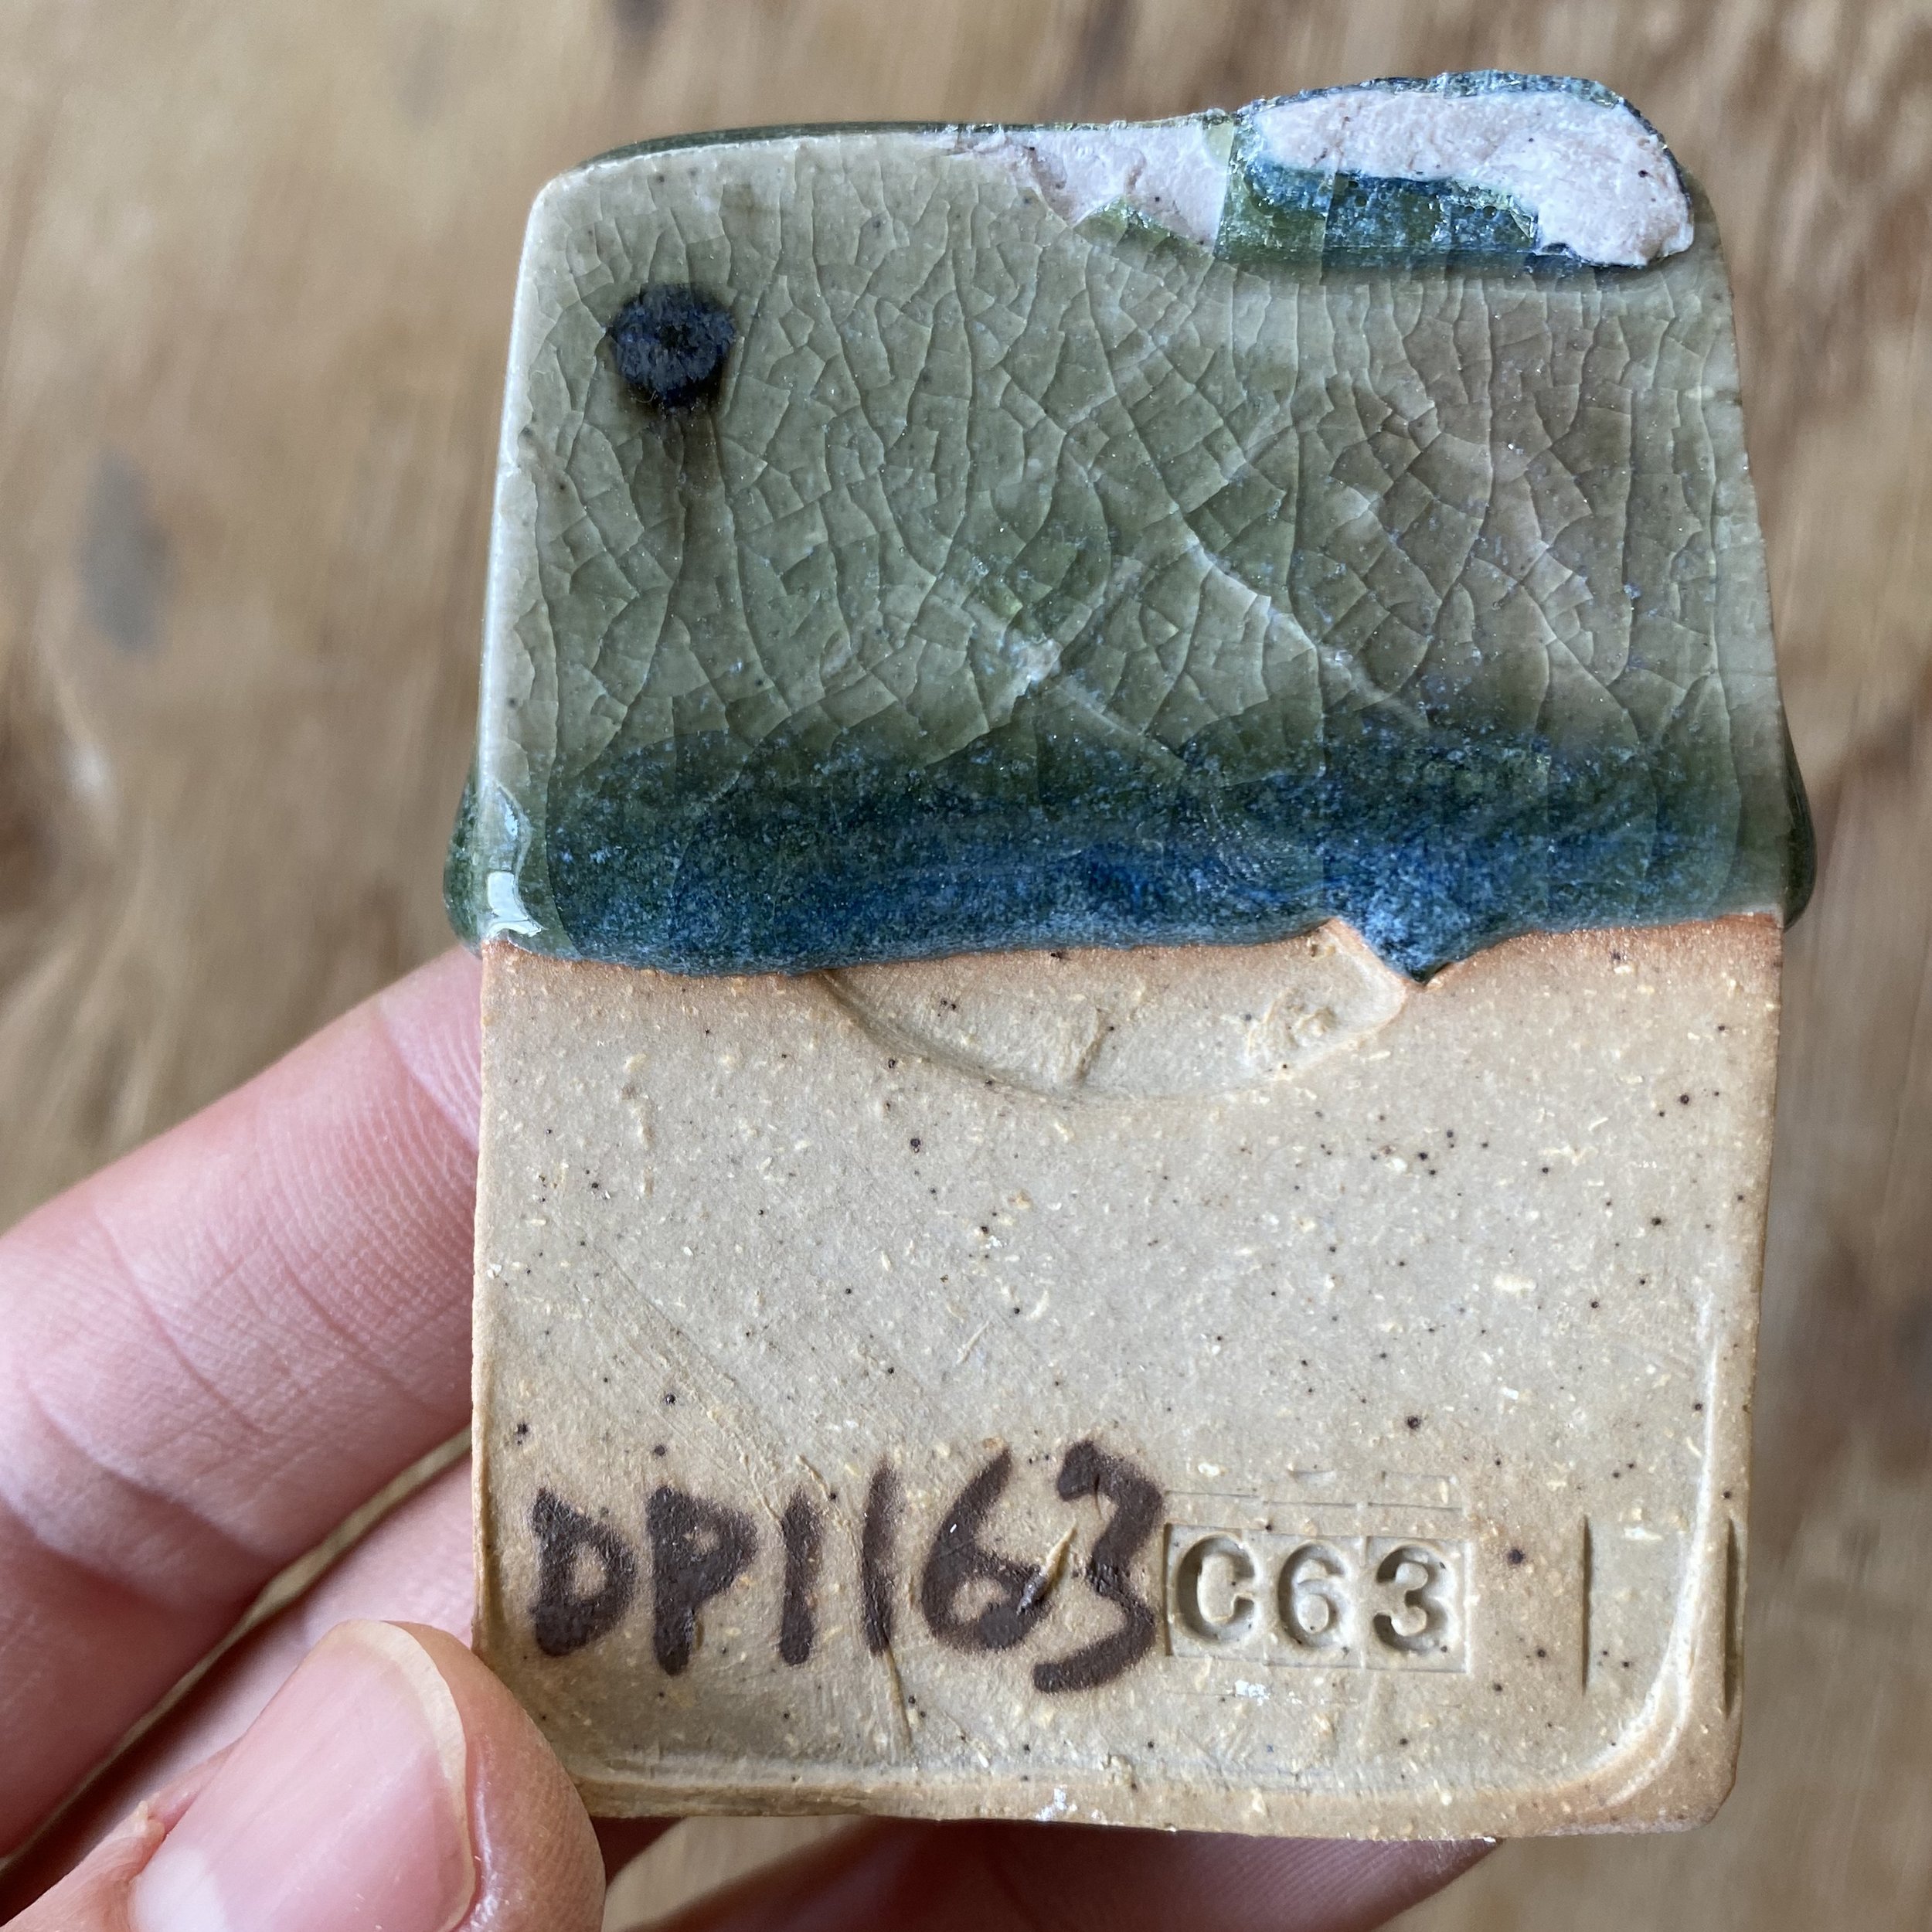
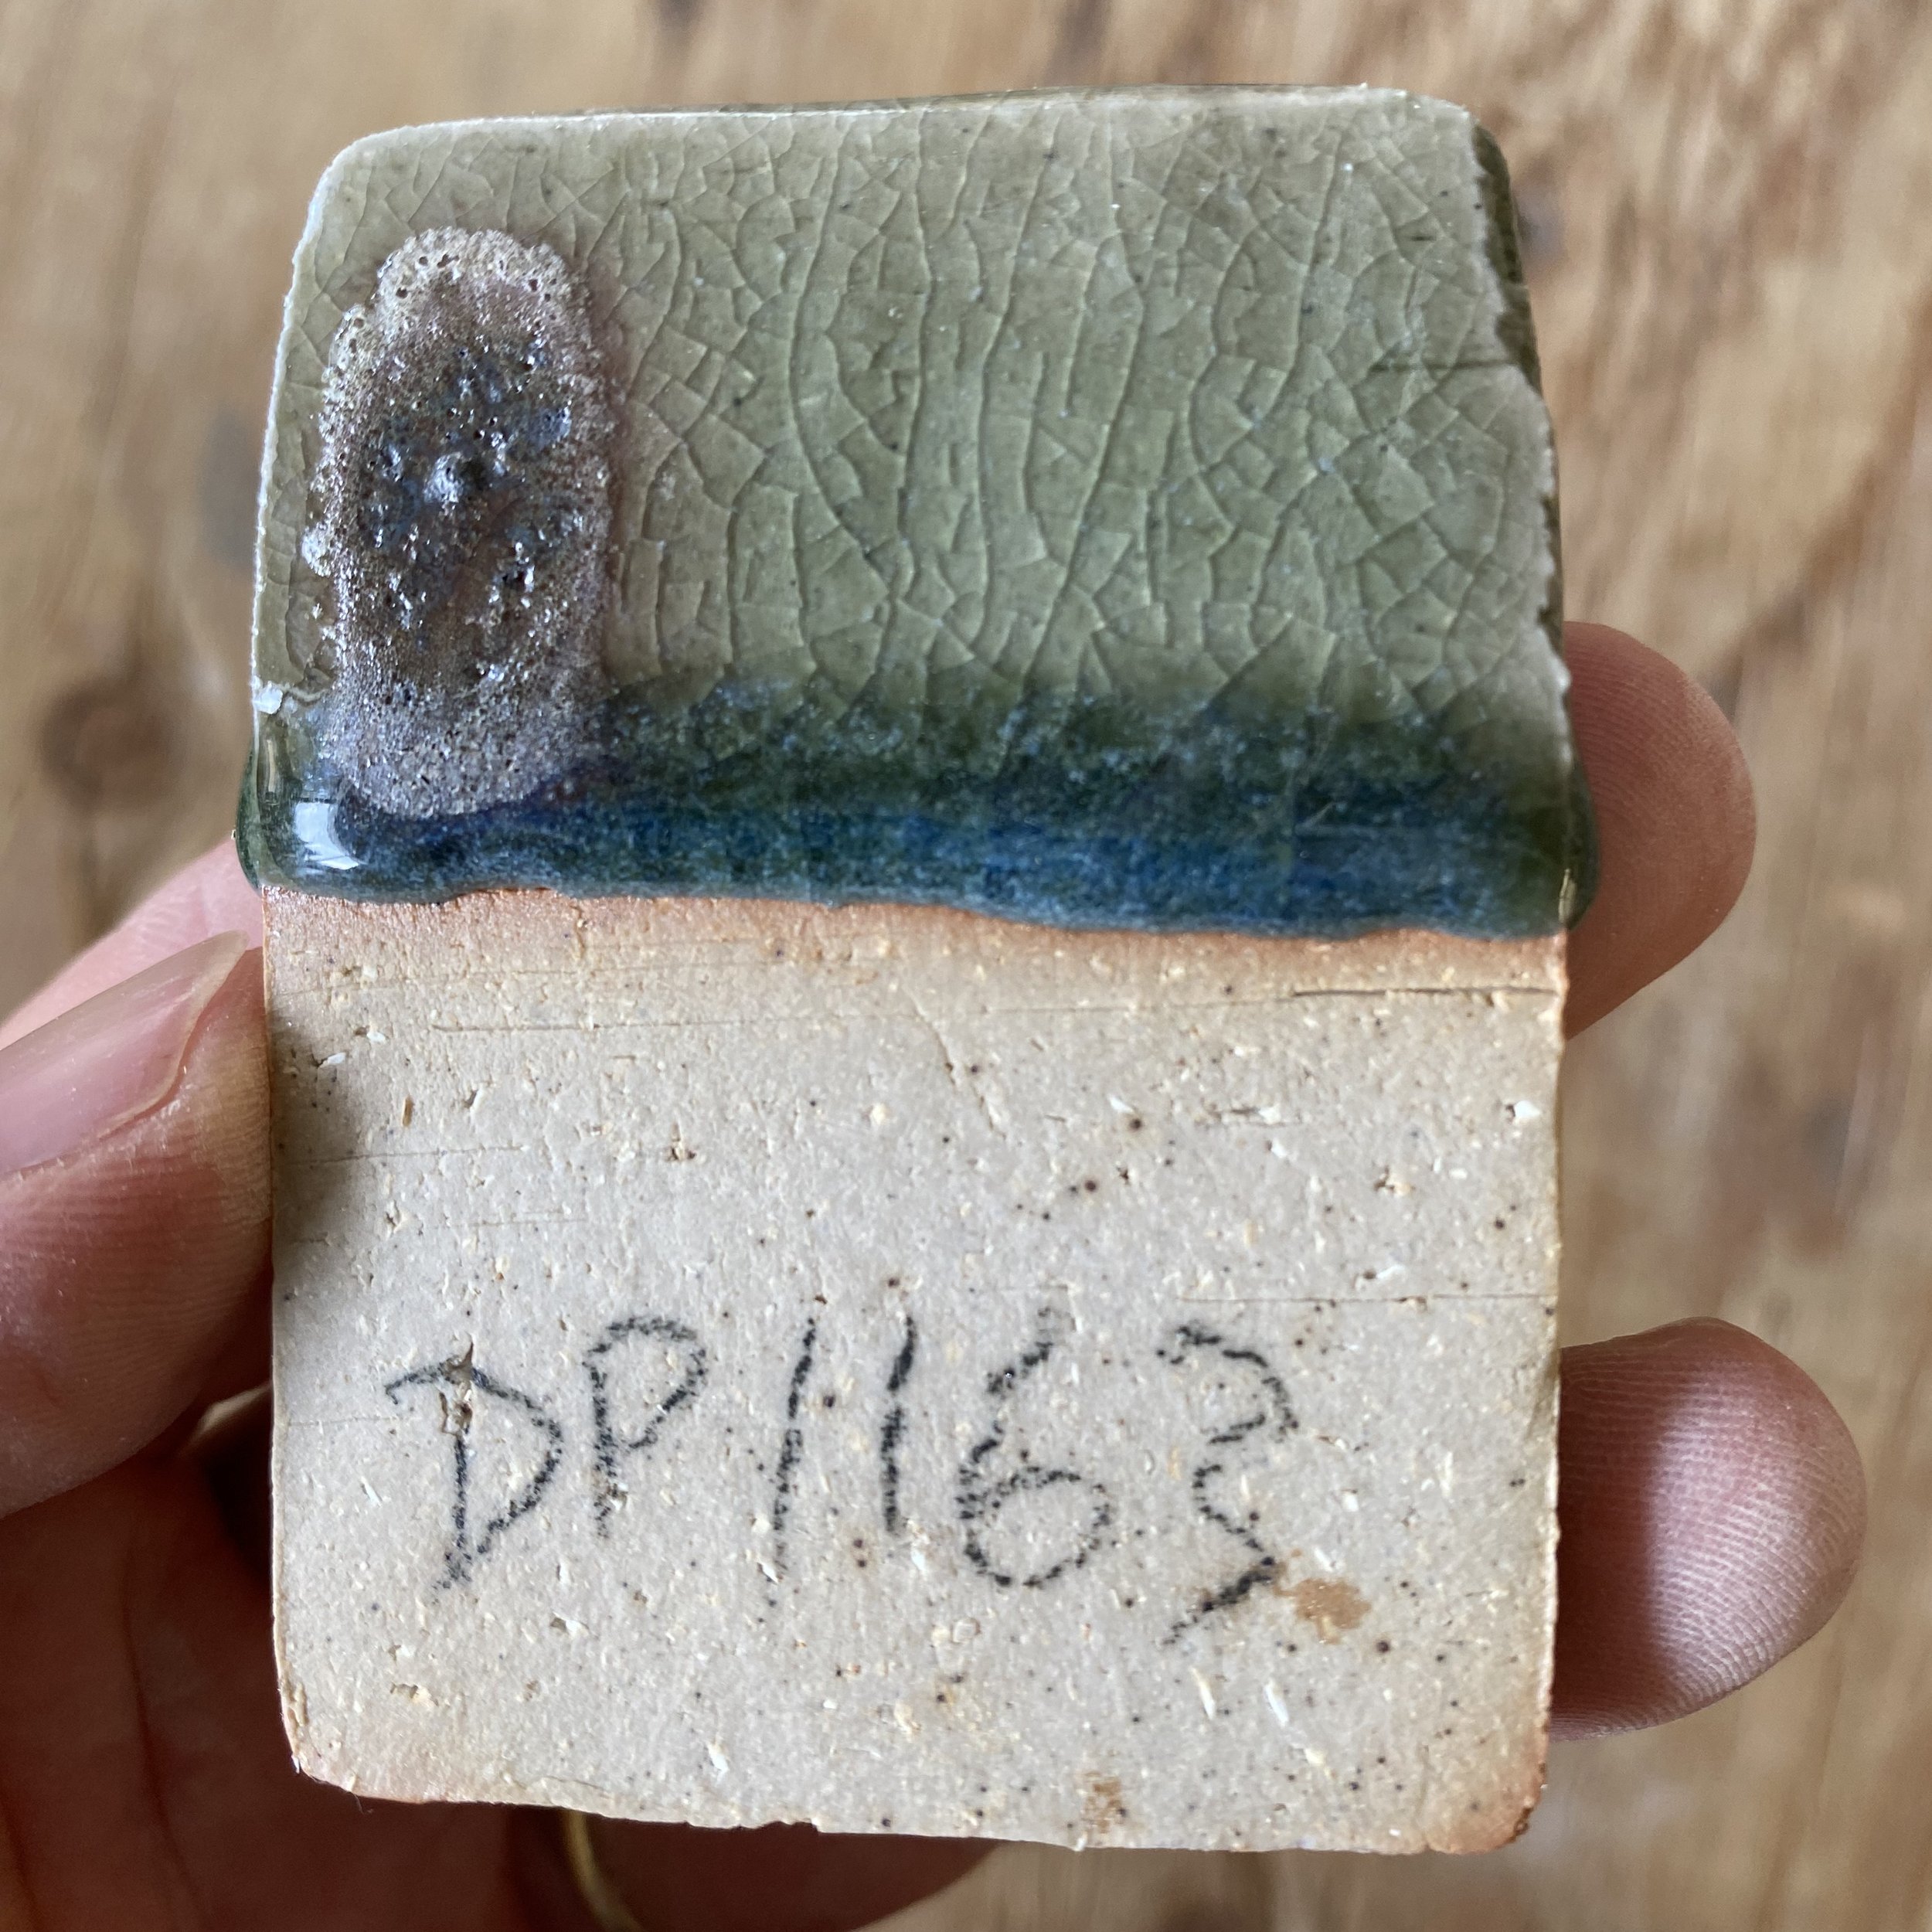
DP1163 (I knocked the glaze off this tile on the way into the kiln so the small test tile is not a good representation of the glaze):
DP1164 (you can see the chun effect starting a little here where the glaze is thickest):
DP1165 (you can see the chun effect starting a little here where the glaze is thickest):
DP1166 (you can see the chun effect starting here where the glaze is thickest):
DP1167 (you can see the chun effect starting where the glaze is thickest):
DP1168 (you can see the chun effect starting a little here where the glaze is thickest):
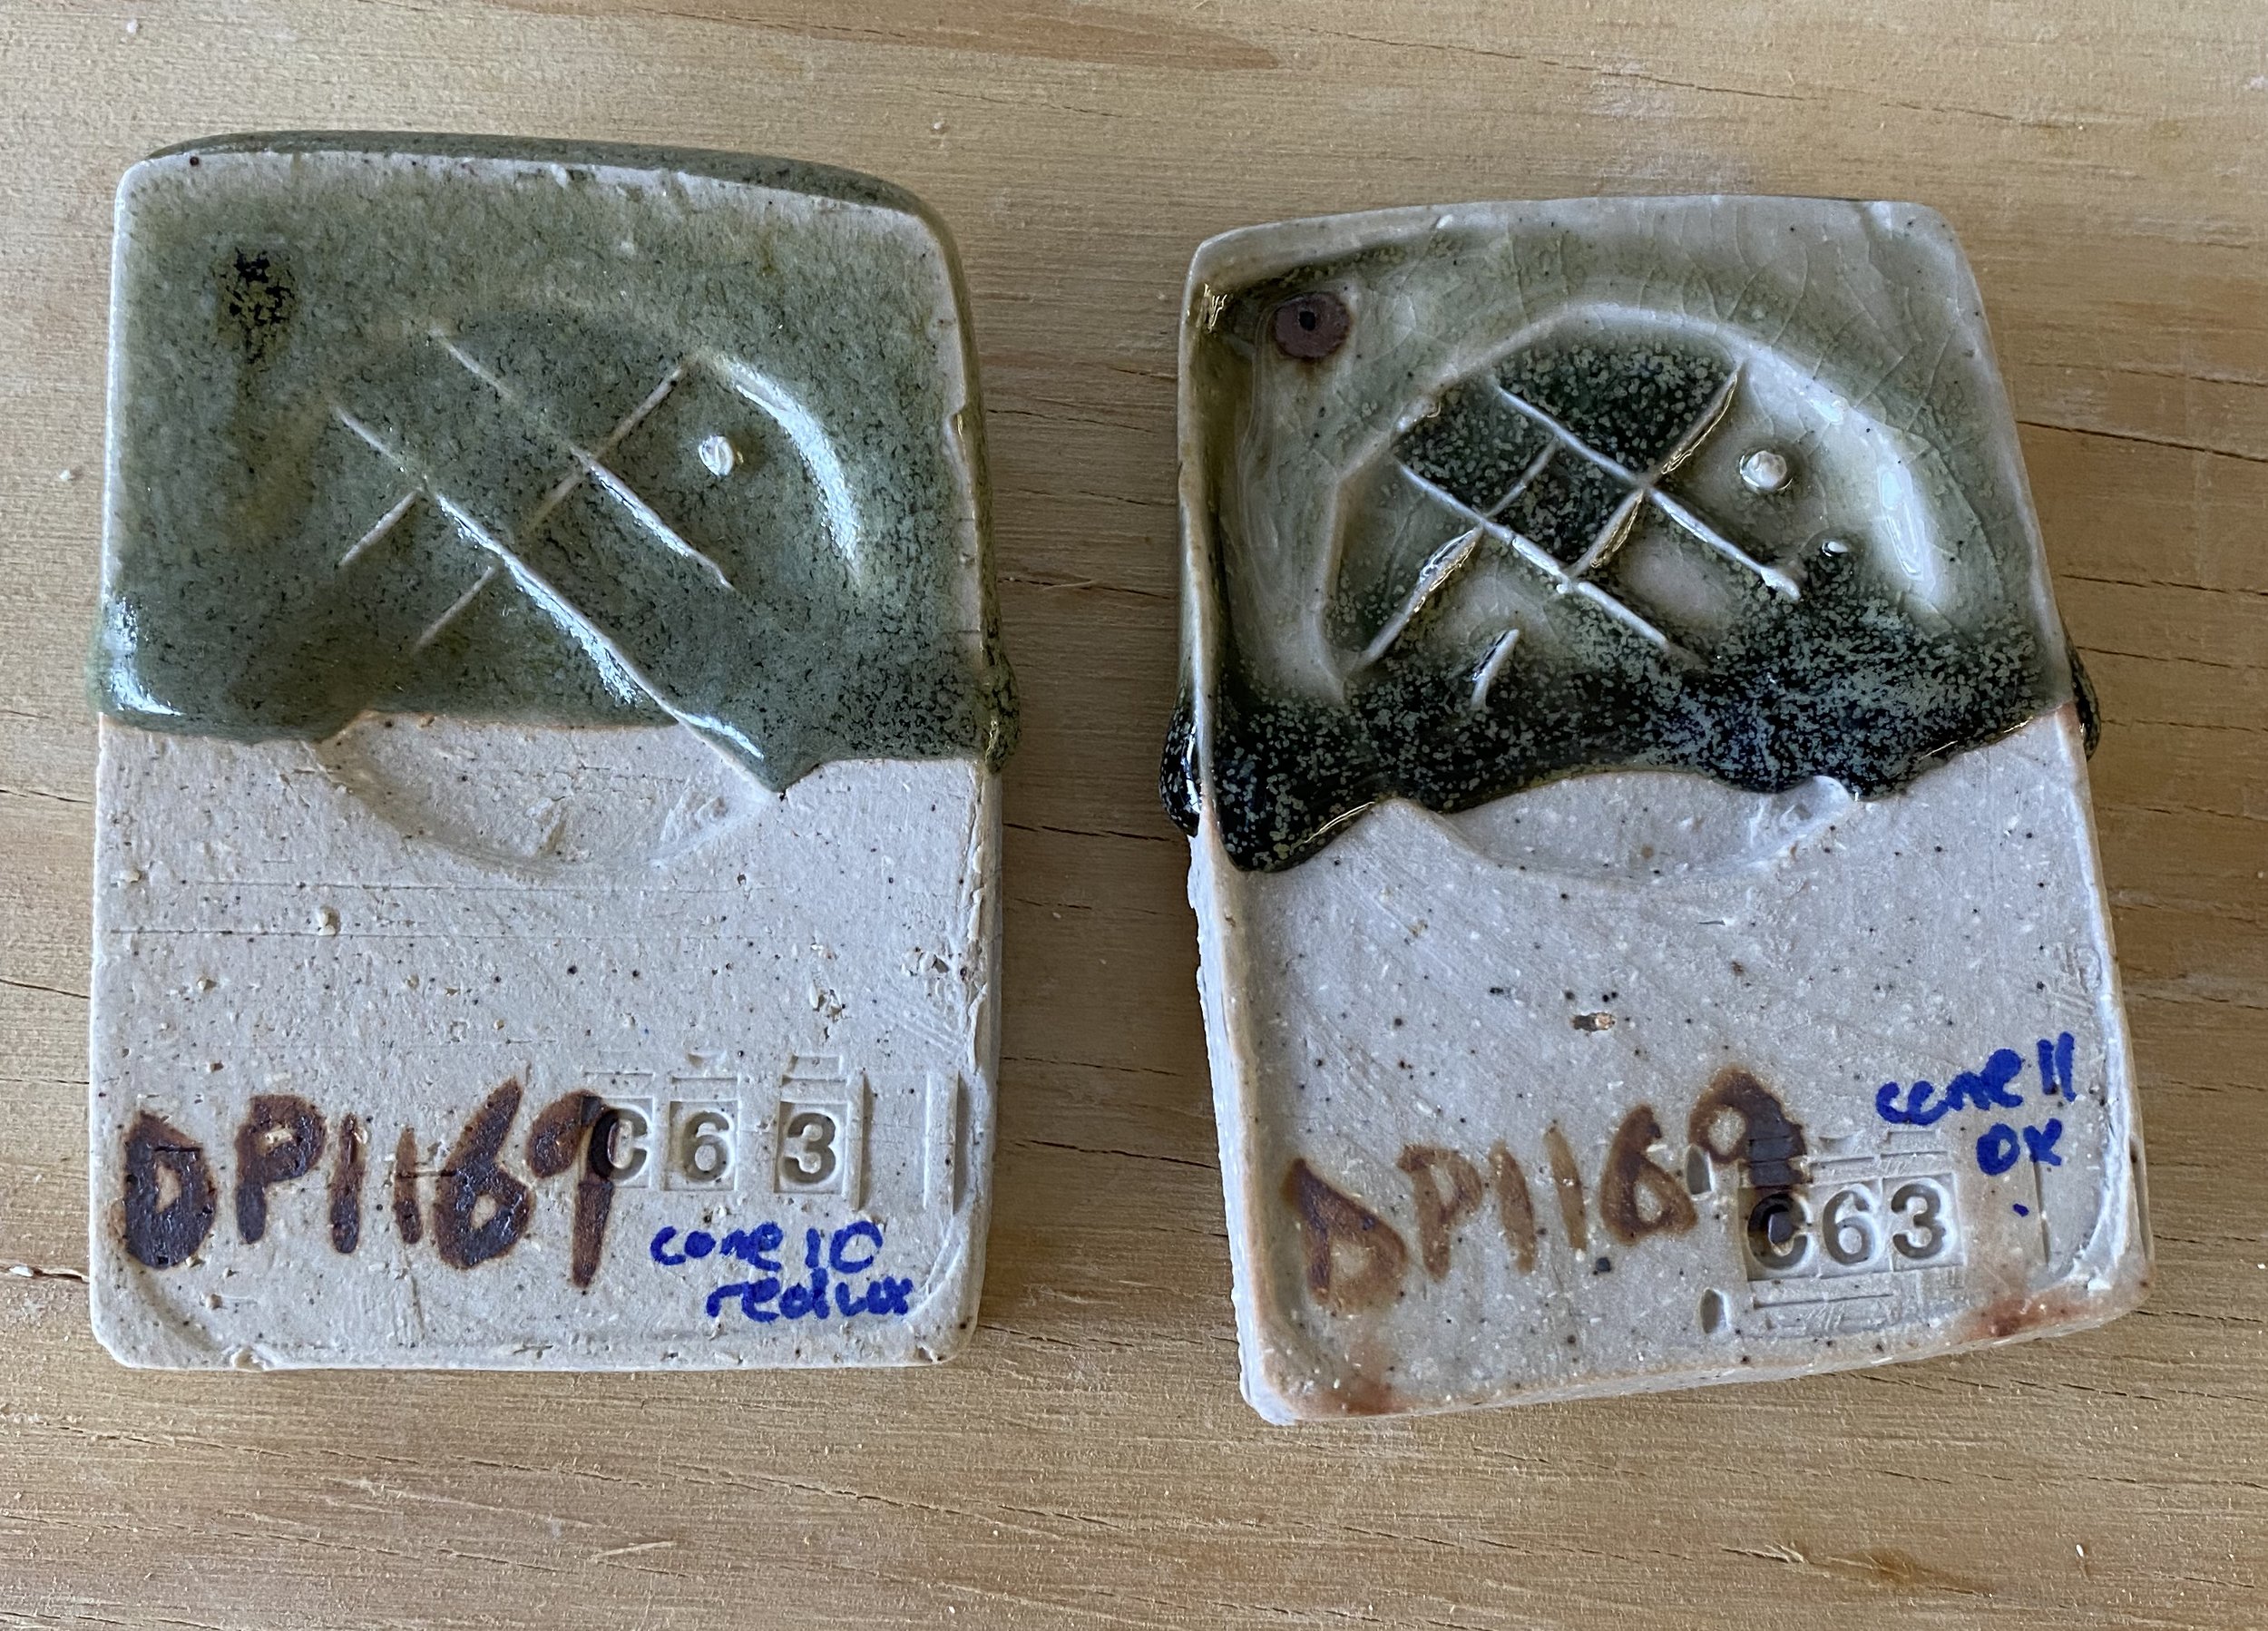
DP1169. The last couple of pictures show DP1169 fired to cone 11: much less crystallized. This glaze matted out because of too much magnesium I think: this comes from both the talc and dolomite.
DP1170 (you can see the chun effect starting a here where the glaze is thickest: nice color!):
DP1171 (you can see the chun effect starting a here where the glaze is thickest):
Here is a broad view again but this time with the same tiles fired to cone 11 underneath. As you might expect the glazes ran more, but also I saw less chun effects.
IHere are the cone 11 tests closer up (the ones off the wooden board)…
In the literature there were some hints that higher temps aided the chun effect but I did not find this-at least not with these formulations. Maybe with stiffer, more silica rich glazes this may prove true. I will continue to test to cone 11 but it seems like cone 10 in reduction is the ticket.
Overall I was encouraged by the cone 10 tests. I did not achieve a chun glaze but there were hints of phase separation, and the formation of bubbles. I was also encouraged by the color of the copper carbonate, applied under the glaze. I just love the old song dynasty chun glazes with purple sashes. Research from various sources has confirmed this was copper applied sometimes under or over the glaze. I tired it out in the hopes that it would work and was surprised to see that it did.
After going back to the drawing board and reading through my notes again I think I figured I should try pumping up the silica content in the glazes. I plan to do an Ian Currie style grid to give myself 35 glaze combinations in short order… hopefully that gets me closer to a chun.
Hope springs eternal!
REVISION:
Since writing this blog post I have tested these same 12 initial tests in a much more reduced firing (gas firing 6), with an intentional reduction down firing. The results were pretty similar I’d say. Here they are…
Rock analysis for potters: XRF data and how it has helped me calculate glaze recipes
It took me a while to get around to sending my favorite rocks off to be analysed. I had wanted to try doing it myself at Utah State University, or at least going through our geology department. Unfortunately, the USU XRF (X-ray flourescence) machine was not working and it did not seem like a fix was coming soon. So, after a fair bit of trying, it became clear I should send them off.
A geology professor and friend recommended Washington State University’s lab. I contacted them and found them very responsive and professional to work with. I sent off three of the rocks I have been experimenting with for analysis:
DP: Devil’s Playground granite
CM: Craters of the Moon basalt (collected outside the national park)
HD: Hyrum Dam lake sediment
The results came back in 6-8 weeks, and cost $60 per sample. As a student from a research institute, I got a deal; normally they charge $120 per sample. Below is the meat of the analysis I received in an Excel spreadsheet…
This may not look very interesting to you, but to me, after having performed many “trial and error” glaze tests with these materials, it was fascinating.
I can now say, after having run some tests with the knowledge of what is in my rocks, that this information is invaluable. I did manage to hit on some nice glazes with a more haphazard, trial and error approach, but now my tests can be much more focused.
How come?
I inputed the data above into glazy, so now I have these materials in my tool kit. Let’s say I want to aim at a tenmoku and find a nice-looking recipe on glazy. I can now target that recipe, substituting my materials for some in the recipe. For my granite, I can reliably substitute out some or all the feldspar and silica in a recipe. Theoretically, if you target a recipe and match the unity molecular formula with new materials, the glaze should come out the same.
You would go through this process if a mine stopped producing a material you used. This happens all the time to potters… feldspars especially seem to go out of production with alarming regularity. I know from experience that these mathematical substitutions rarely work 100%, but they get you close… really pretty close. A few tests around the area should get you to the desired result quickly. Far, far quicker and with fewer tests than the way I was doing it before.
Why not go and collect your own materials and use them instead of relying on industry? Getting a XRF analysis and using glazy represents some upfront cost, but in the long run, you will have unique materials and ones that will never run out. Once you learn your materials, making each new glaze becomes much easier.
I am thrilled with this new method. New to me anyway, haha. I take no credit for it whatsoever. It just took me a long time to come round to the idea. Two great book to get you started in this way of testing glazes are Matt Blakely’s “Rock Glazes Unearthed” and Ian Currie’s two books detailing the “Grid Method.”
If you have any questions, don’t hesitate to reach out to me. I am always happy to talk about glazes! My email is hamish.jx@gmail.com
And here is the link to the geo lab at WSU again: https://environment.wsu.edu/facilities/geoanalytical-lab/service/sample-submittal/


